-
Bug
-
Resolution: Fixed
-
Major
-
windows jenkins server
windows client
chrome browser
autorefresh is enabled
-
Powered by SuggestiMate
leaving the dashboard webpage open (with autorefresh) will accumulate lots of memory. I left it open over the weekend and it was using over 700 MB of ram! you can watch the memory consumption increase ~3-10 MB every time it refreshes (manually or automatically). Sometimes it will decrease to the pre-refreshed amount, but it will always increase over time (instantaneous readings may/may not prove true, but long term averages will).
- mem_1.457.jpg
- 46 kB
- mem_1.460.jpg
- 34 kB
- OoM.jpg
- 8 kB
[JENKINS-10912] Browser/JS memory leak in dashboard
I've noticed this on Jenkins 1.460, running on Windows, I'm using FireFox. My Jenkins instance seems to be constantly growing in size, I hoped upgrading to 1.460 from approx. 1.420 would help, but doesn't seem to be doing so. This morning I notice that with 1.460, and autorefresh off, just navigating from one Jenkins page to another causes memory usage to increase several K, and space never seems to be recovered. Our Jenkins instance is quiet this morning, no jobs running.
I think this should be filed against core, not the dashboard view plugin.
We are seeing this problem too (on v1.461). Over time Jenkins uses about 700MB for about 10 jobs. The 'Monitoring' plugin (quite useful by the way) lets you do a garbage collection but that cleared up only 30MB. The histogram shows about 150MB usage over the past week and then a quick ramp yesterday from 150MB to 700MB. There was a jump in number of sessions from 3 to 9 around the time just before the ramping in memory usage happened. I am not sure if its related and the number of sessions dropped to 4 a bit after. CPU usage is also quite high right now, mostly tying down one CPU core.
Memory histogram shows this:
Class Size (Kb) % size Instances % instances
byte[] 132,623 17 179,202 1
char[] 125,861 16 1,630,859 9
java.util.HashMap$Entry 65,111 8 2,778,092 16
java.util.HashMap$Entry[] 51,225 6 700,897 4
java.lang.String 43,672 5 1,863,370 11
java.lang.Object[] 30,612 4 453,476 2
java.util.WeakHashMap$Entry 28,414 3 727,415 4
java.util.HashMap 27,029 3 691,947 4
java.util.WeakHashMap$Entry[] 19,986 2 194,526 1
java.util.Hashtable$Entry[] 17,852 2 311,216 1
java.util.Hashtable 11,176 1 286,110 1
java.util.WeakHashMap 9,118 1 194,526 1
org.apache.commons.jelly.JellyContext 8,378 1 214,498 1 storage/sw/hudson/war/WEB-INF/lib/commons-jelly-1.1-jenkins-20110627.jar
org.kohsuke.stapler.jelly.ReallyStaticTagLibrary$1 8,090 1 115,058 0 storage/sw/hudson/war/WEB-INF/lib/stapler-jelly-1.187.jar
java.lang.String[] 7,711 1 174,016 1
java.util.ArrayList 7,655 1 326,640 1
We recently switched from using Jetty as a container for Jenkins to Winstone. But again, I don't know if that is relevant.
This seems to happen only when using Chrome, possibly having auto-refresh enabled and leaving the tab open all the time.
We have also Problems with Firefox on Linux and Windows 7 and Internet Explorer on Windows 7.
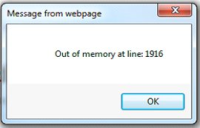
After some time IE shows following error:

In this case, autorefresh was disabled.
We observed this memory leak using Jenkins 1.457 and 1.459. Currently we are using 1.454. This version seems to have no problem with memory leaks in browser.
I changed Priority to Major, because our developers are not willing to use a version with this issue.
Firefox 12.0 on Ubuntu 12.04 with Jenkins 1.4.63 with auto-refresh and Jenkins tab open all the time doesn't result in memory leak for us.
Memory consumption Firefox 12.0 (Red Hat Enterprise Linux Server release 6.0)
It seems the problem disappeared.
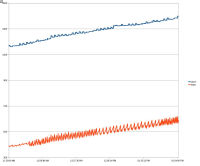
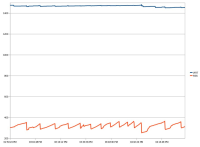
I made a memory consumption log of Firefox 12 on Red Hat Enterprise Linux 6.0 with top in batch mode. I opened dashboard and let Jenkins alone.
The following diagram shows increase of memory with Jenkins 1.457:

and here constant memory with Jenkins 1.460:

We still experience the problem in Jenkins 1.459. Leave the dashboard open during the night and memory will be eaten.
Both Firefox and Chrome seems to be affected. OS is Ubuntu.
I'm still getting this error on 1.472. The problem occurred, when they upgraded prototype.js to 1.7. After running the Google Chrome memory profiler, it seems that there is a leak of the prototype_event_registry object. I saw a few posts on memory leaks in prototype.js file, and tried all their solutions, but none worked. I had to downgrade back to 1.454.
Please disregard all my comments - our leak is on the server side not browser/client side.
We also have client-side memory problems. Running Jenkins 1.471, seen with both IE and Firefox. It builds up major memory "waste" overnight, and I'm not using auto-refresh.
I took a snapshot of Firefox's about:memory the other day, after one night of Jenkins (here only the Jenkins compartment is shown):
1,165.05 MB (100.0%) ++  -- explicit
├────730.22 MB (62.68%) ── heap-unclassified
├────419.95 MB (36.05%) ++  -- js
│    ├──325.76 MB (27.96%) ++  -- compartment(http://jenkins/)
│    │  ├──256.25 MB (22.00%) ++  -- gc-heap
│    │  │  ├──167.00 MB (14.33%) ++  -- objects
│    │  │  │  ├──126.47 MB (10.86%) ── non-function
│    │  │  │  └───40.52 MB (03.48%) ── function
│    │  │  ├───76.72 MB (06.58%) ++  -- shapes
│    │  │  │   ├──64.94 MB (05.57%) ── dict
│    │  │  │   └──11.78 MB (01.01%) ++  -- (2 tiny)
│    │  │  │      ├──11.44 MB (00.98%) ── base
│    │  │  │      └───0.34 MB (00.03%) ── tree
│    │  │  ├───11.92 MB (01.02%) ++  -- arena
│    │  │  │   ├───7.62 MB (00.65%) ── unused
│    │  │  │   ├───2.30 MB (00.20%) ── padding
│    │  │  │   └───2.00 MB (00.17%) ── headers
│    │  │  └────0.61 MB (00.05%) ++  -- (3 tiny)
│    │  │       ├──0.46 MB (00.04%) ── scripts
│    │  │       ├──0.12 MB (00.01%) ── type-objects
│    │  │       └──0.03 MB (00.00%) ── strings
│    │  ├───37.10 MB (03.18%) ++  -- shapes-extra
│    │  │   ├──36.47 MB (03.13%) ── dict-tables
│    │  │   └───0.63 MB (00.05%) ++  -- (3 tiny)
│    │  │       ├──0.50 MB (00.04%) ── tree-tables
│    │  │       ├──0.08 MB (00.01%) ── tree-shape-kids
│    │  │       └──0.05 MB (00.00%) ── compartment-tables
│    │  ├───27.99 MB (02.40%) ── object-slots
│    │  └────4.41 MB (00.38%) ++  -- (7 tiny)
│    │       ├──2.01 MB (00.17%) ── object-elements
│    │       ├──0.97 MB (00.08%) ── analysis-temporary
│    │       ├──0.66 MB (00.06%) ── script-data
│    │       ├──0.45 MB (00.04%) ── mjit-code
│    │       ├──0.25 MB (00.02%) ++  -- type-inference
│    │       │  ├──0.16 MB (00.01%) ── object-main
│    │       │  ├──0.05 MB (00.00%) ── script-main
│    │       │  └──0.03 MB (00.00%) ── tables
│    │       ├──0.05 MB (00.00%) ── mjit-data
│    │       └──0.02 MB (00.00%) ── string-chars
Then I did a refresh (F5), which caused the machine+firefox to thrash for 10-15 minutes while it cleaned up its memory. After the dust settled, about:memory said this (again cut to Jenkins):
146.06 MB (100.0%) ++  -- explicit
├───96.13 MB (65.82%) ++  -- js
│   ├──59.40 MB (40.67%) ── gc-heap-decommitted
│   ├──10.38 MB (07.11%) ++  -- compartment(http://jenkins/)
│   │  ├───6.78 MB (04.64%) ++  -- gc-heap
│   │  │   ├──4.00 MB (02.74%) ++  -- arena
│   │  │   │  ├──3.88 MB (02.66%) ── unused
│   │  │   │  └──0.12 MB (00.08%) ++  -- (2 tiny)
│   │  │   │     ├──0.06 MB (00.04%) ── padding
│   │  │   │     └──0.05 MB (00.04%) ── headers
│   │  │   └──2.78 MB (01.90%) ++  -- (5 tiny)
│   │  │      ├──1.24 MB (00.85%) ++  -- objects
│   │  │      │  ├──0.72 MB (00.50%) ── non-function
│   │  │      │  └──0.51 MB (00.35%) ── function
│   │  │      ├──0.94 MB (00.64%) ++  -- shapes
│   │  │      │  ├──0.45 MB (00.31%) ── dict
│   │  │      │  ├──0.34 MB (00.23%) ── tree
│   │  │      │  └──0.15 MB (00.11%) ── base
│   │  │      ├──0.46 MB (00.31%) ── scripts
│   │  │      ├──0.12 MB (00.08%) ── type-objects
│   │  │      └──0.03 MB (00.02%) ── strings
│   │  └───3.60 MB (02.47%) ++  -- (9 tiny)
│   │      ├──1.10 MB (00.75%) ── analysis-temporary
│   │      ├──0.85 MB (00.58%) ++  -- shapes-extra
│   │      │  ├──0.50 MB (00.34%) ── tree-tables
│   │      │  ├──0.23 MB (00.16%) ── dict-tables
│   │      │  ├──0.08 MB (00.05%) ── tree-shape-kids
│   │      │  └──0.05 MB (00.03%) ── compartment-tables
│   │      ├──0.66 MB (00.45%) ── script-data
│   │      ├──0.45 MB (00.31%) ── mjit-code
│   │      ├──0.26 MB (00.18%) ++  -- type-inference
│   │      │  ├──0.16 MB (00.11%) ── object-main
│   │      │  ├──0.07 MB (00.05%) ── script-main
│   │      │  └──0.03 MB (00.02%) ── tables
│   │      ├──0.20 MB (00.14%) ── object-slots
│   │      ├──0.05 MB (00.04%) ── mjit-data
│   │      ├──0.02 MB (00.01%) ── string-chars
│   │      └──0.01 MB (00.01%) ── object-elements
Much better, and I remember to close my browser after work ...
I believe that this is an issue for me also.
If we open a browser on the PC running the Jenkins server (Windows7 on a VM) and leave it, the memory usage of the Jenkins java.exe process goes through the roof and kills the machine.
Is there anything I can provide in order to help debug the issue?
Same for me. I'm using Jenkins 1.480.1 (LTS). The Jenkins tab in Chrome (Windows 7) gets very slow, and the "Chrome Task Manager" shows that it has used up 700+ MB of memory. So I have to kill and re-open it once in a while.
When a lot of jobs are building and Auto-refresh is on, the memory usage can increase by a full Megabyte every 10 seconds or so.
Jenkins 1.505: still a problem with IE 8 on Windows 7
After 1 hour IE needs to be restarted because no memory was left.
Suspect the memory leak is caused by the refreshPart method in hudson-behavior.js
Heap snapshot shows detached DOM elements that related to the content that are refreshed by the method.
Changing the refreshPart to just update innerHTML (hist.innerHTML = rsp.responseText;) seems to fix "some" of the memory leak.
// refresh a part of the HTML specified by the given ID,
// by using the contents fetched from the given URL.
function refreshPart(id,url) {
    var f = function() {
        if(isPageVisible()) {
            new Ajax.Request(url, {
                onSuccess: function(rsp) {
                    var hist = $(id);
                    if (hist==null) console.log("There's no element that has ID of "+id)
                    var p = hist.up();

                    hist.innerHTML = rsp.responseText;

                    //var div = document.createElement('div');
                    //div.innerHTML = rsp.responseText;
                    //
                    //var node = $(div).firstDescendant();
                    //p.replaceChild(node, hist);
                    //
                    //Behaviour.applySubtree(node);
                    //layoutUpdateCallback.call();

                    if(isRunAsTest) return;
                    refreshPart(id,url);

                }
            });
        } else {
            // Reschedule
            if(isRunAsTest) return;
            refreshPart(id,url);
        }

    };
    // if run as test, just do it once and do it now to make sure it's working,
    // but don't repeat.
    if(isRunAsTest) f();
    else    window.setTimeout(f, 5000);
}
This is still a huge issue in 1.544 and does not seem to be browser specific, although some cope better than others. I opened a Chrome 31 (CR), Firefox 26 (FX), IE8 (IE) and IE8 64bit(IE64) instance and opened the mainpage of jenkins. Autorefresh is deactivated. System is a 4GB RAM Windows 7 64bit Pro Machine, and this is the consumption over time:
| Browser | Start | +30min | +60min | +90min | +21h |
|---|---|---|---|---|---|
| CR | 21.9M | 37.6M | 61.3M | 84.5M | 451.8M |
| FX | 95.9M | 117.9M | 138.6M | 159.2M | ? |
| IE | 36.1M | 114.3M | 206.1M | 301.5M | ? |
| IE64 | 67.8M | 175.7M | 305.2M | 438.8M | 2.5G |
Memory consumption was supervised using the chrome://memory-redirect page and the Windows Resource Monitor.
After the 21h, the system was unusable and it seemed that the 32bit IE and FX instances were killed/zombified by the system. A message was shown that the a script (prototype.js in line 323) was taking very long to process and if i wanted to kill it.
Further pieces of information i found during this test run:
- IE8 complains about a javascript error in sortable.js (line 209, char 17): 'null' is null or not an object
- in the CR developer console i can see continuos POST requests to prototype.js:1585 from ajaxBuildQueue and ajaxExecutors
- also in CR i see an warning in dom-min.js:8 "body.scrollLeft is deprecated in strict mode. Please use 'documentElement.scrollLeft' if in strict mode and 'body.scrollLeft' only if in quirks mode."
- Firefox developer console shows a lot of CSS warnings
Hope any of this helps.
Clarified this is a UI/client-side issue in the title and component.
What happens when Autorefresh is disabled? Same issue?
Could someone please respond to my previous comment? Does it only affect use of auto-refresh?
In my case auto-refresh is disabled, so I guess it's not related (Jenkins ver. 1.576).
I've seen this here too.
The partial fix with innerHtml (which is the same as this stack overflow thing here: http://stackoverflow.com/a/3785323/490188) perhaps plus Douglas Crockford's purge method might mitigate this.
My simpler and brute force fix is a GreaseMonkey script:
if(location.pathname.indexOf('config') == -1) {
  //Reload every hour
  window.setTimeout(function() {location.reload()}, 1000 * 60 * 60)
}
Which will do for some of our extreme feedback monitors, or accidentally leaving it open overnight in a browser tab.
I see a significant memory leak on ci.centos.org - it doesn't affect just the Dashboard. The memory usage for that tab increases to 1.7GB in Chrome and 1GB in Safari, over less than 3 hours (I also see this with Firefox on both OS X and Linux, although the memory increase seems less steep). I posted details on the centos-devel mailing list.
The Chrome Developer Tools point to refreshPart from hudson-behavior.js as the culprit. Indeed, using 'delete node' from the Inspector to remove the #buildQueue and #executors divs stops the memory leak. I created a self-contained test to illustrate the problem, using just plain Javascript, without any external libraries: https://github.com/lpancescu/xhr-memory-leak.
The least intrusive fix for Jenkins would be to remove the call to refreshPart from function f, and use setInterval instead of setTimeout (this is what noleak.html from my test repo does). The more elegant solution would be to use Ajax.PeriodicalUpdater from Prototype.js, which is designed for this use case. If you tell me which variant you prefer, I can send you a pull request on GitHub.
lpancescu Depending on how extensive the change for PeriodicUpdater is, it'll probably be easier to get the apparently minimal fix of setInterval integrated. If it's easy enough to do so enough, you could also open two PRs and indicate they are alternative solutions.
I implemented the 'elegant' way in my test repo (noleak-prototype.html) and tested for 6 hours. It doesn't leak memory, but I can't use it in a Jenkins context, since the server response includes the divs whose content should be replaced, and I'd still need to rebind the behaviors to the received DOM tree anyway.
The 'minimal' fix is better in this case - please see pull request #2539.
Code changed in jenkins
User: lpancescu
Path:
war/src/main/webapp/scripts/hudson-behavior.js
http://jenkins-ci.org/commit/jenkins/096614a6d72c19633909248cb5b06a179b8b4040
Log:
JENKINS-10912 Use setInterval in refreshPart (#2539)
JENKINS-10912Use setInterval in refreshPart
The current implementation of refreshPart creates a new closure every 5
seconds, which, in combination with XMLHttpRequest objects, results in a
significant memory leak in all major browsers. By using
window.setInterval to schedule periodic refreshes, only one closure per
id is created. Please see issue #10912 in the Jenkins tracker for
further details.
- Stop periodical calls if we can't find the div
- Don't check if isRunAsTest changed after page load
Which version of LTS core this fix is merged into? We are having same issue with 1.642.3 LTS ![]()
Code changed in jenkins
User: lpancescu
Path:
war/src/main/webapp/scripts/hudson-behavior.js
http://jenkins-ci.org/commit/jenkins/2f0632ae189a11b439e10a59918434f3248a5787
Log:
JENKINS-10912 Use setInterval in refreshPart (#2539)
JENKINS-10912Use setInterval in refreshPart
The current implementation of refreshPart creates a new closure every 5
seconds, which, in combination with XMLHttpRequest objects, results in a
significant memory leak in all major browsers. By using
window.setInterval to schedule periodic refreshes, only one closure per
id is created. Please see issue #10912 in the Jenkins tracker for
further details.
- Stop periodical calls if we can't find the div
- Don't check if isRunAsTest changed after page load
(cherry picked from commit 096614a6d72c19633909248cb5b06a179b8b4040)


I've noticed memory inflation of 1GB overnight with our Jenkins, and the issue seems to be present on the demo jenkins (http://ci.jenkins-ci.org/). I didn't leave it open for that long, but it did increase by 10MB over 10-15 minutes.
I use Chrome 17 (beta) and tried to see where all that memory was going with dev tools. I tried taking a heap snapshot of my 1GB tab but it crashed it. I tried again after just 10MB of "leak" but couldn't notice much difference in components size. I did notice that memory fluctuates whenever there is network traffic, which occurs when there are ajax requests (ajaxBuildQueue, ajaxExecutors). Those are triggered whether auto refresh is enabled or not (in my case, auto refresh were disabled).