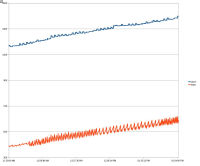
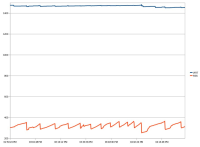
We are seeing this problem too (on v1.461). Over time Jenkins uses about 700MB for about 10 jobs. The 'Monitoring' plugin (quite useful by the way) lets you do a garbage collection but that cleared up only 30MB. The histogram shows about 150MB usage over the past week and then a quick ramp yesterday from 150MB to 700MB. There was a jump in number of sessions from 3 to 9 around the time just before the ramping in memory usage happened. I am not sure if its related and the number of sessions dropped to 4 a bit after. CPU usage is also quite high right now, mostly tying down one CPU core.
Memory histogram shows this:
Class Size (Kb) % size Instances % instances
byte[] 132,623 17 179,202 1
char[] 125,861 16 1,630,859 9
java.util.HashMap$Entry 65,111 8 2,778,092 16
java.util.HashMap$Entry[] 51,225 6 700,897 4
java.lang.String 43,672 5 1,863,370 11
java.lang.Object[] 30,612 4 453,476 2
java.util.WeakHashMap$Entry 28,414 3 727,415 4
java.util.HashMap 27,029 3 691,947 4
java.util.WeakHashMap$Entry[] 19,986 2 194,526 1
java.util.Hashtable$Entry[] 17,852 2 311,216 1
java.util.Hashtable 11,176 1 286,110 1
java.util.WeakHashMap 9,118 1 194,526 1
org.apache.commons.jelly.JellyContext 8,378 1 214,498 1 storage/sw/hudson/war/WEB-INF/lib/commons-jelly-1.1-jenkins-20110627.jar
org.kohsuke.stapler.jelly.ReallyStaticTagLibrary$1 8,090 1 115,058 0 storage/sw/hudson/war/WEB-INF/lib/stapler-jelly-1.187.jar
java.lang.String[] 7,711 1 174,016 1
java.util.ArrayList 7,655 1 326,640 1
We recently switched from using Jetty as a container for Jenkins to Winstone. But again, I don't know if that is relevant.
Bug
Major


I've noticed memory inflation of 1GB overnight with our Jenkins, and the issue seems to be present on the demo jenkins (http://ci.jenkins-ci.org/). I didn't leave it open for that long, but it did increase by 10MB over 10-15 minutes.
I use Chrome 17 (beta) and tried to see where all that memory was going with dev tools. I tried taking a heap snapshot of my 1GB tab but it crashed it. I tried again after just 10MB of "leak" but couldn't notice much difference in components size. I did notice that memory fluctuates whenever there is network traffic, which occurs when there are ajax requests (ajaxBuildQueue, ajaxExecutors). Those are triggered whether auto refresh is enabled or not (in my case, auto refresh were disabled).