-
Bug
-
Resolution: Fixed
-
 Blocker
-
-
workflow-api 2.31
The graph here in this description more clearly depicts whats going on. I'm the only one using this jenkins server today...
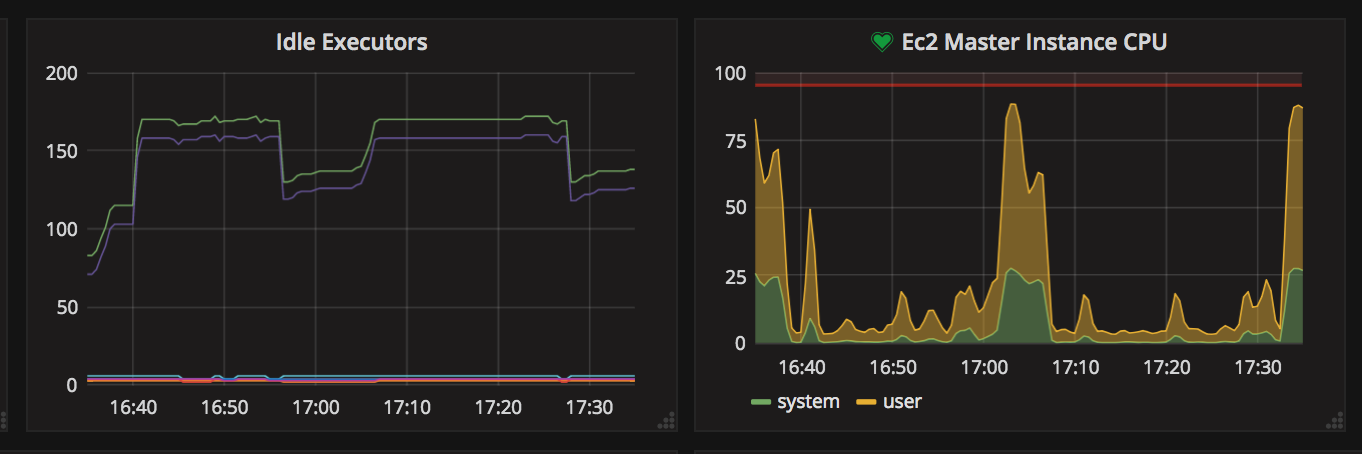
Around 5pm, i kicked off a pipeine. The pipeline builds a container and then uses that container to run some pytests...
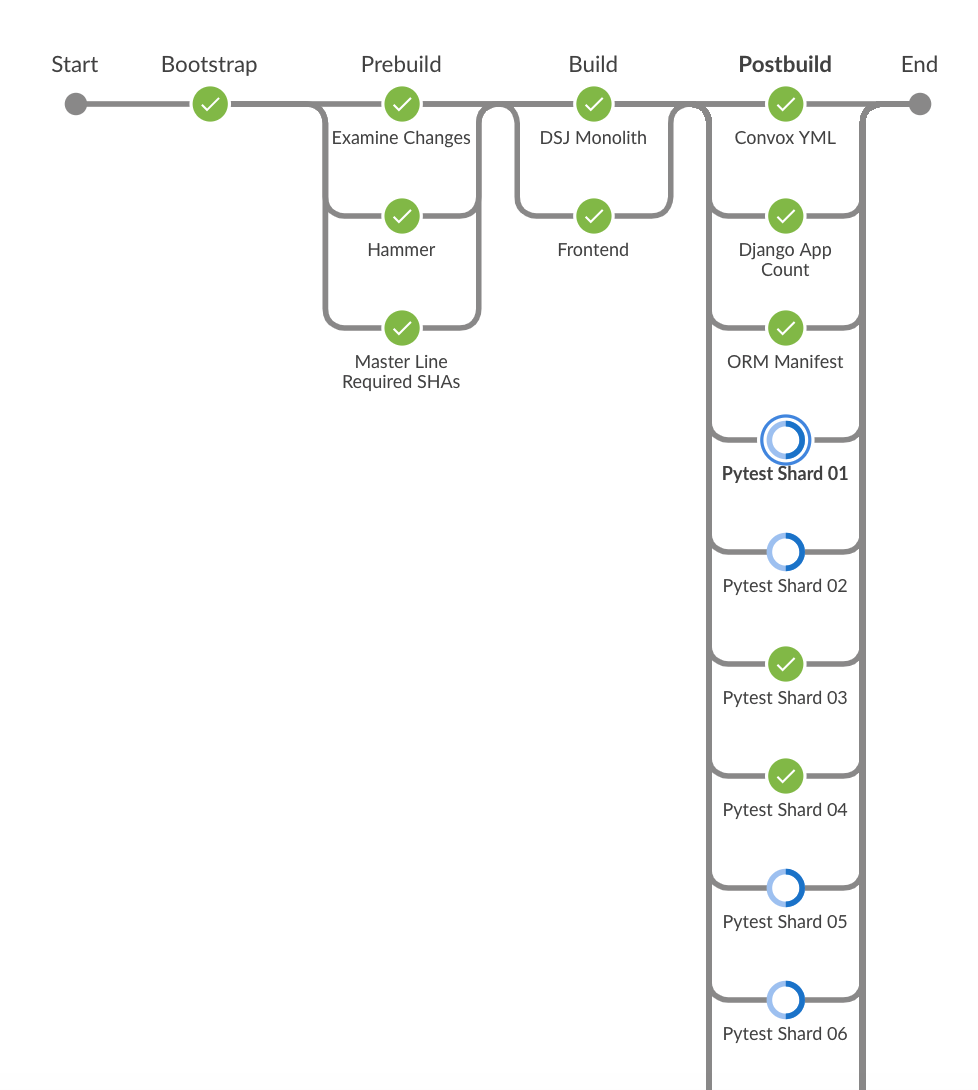
It is during that last "postbuild" phase, the CPU runs real hot. While the pytest shards are running, they are just doing a pytest run and then i capture the junit.xml file.
The reason why this is a problem is that with too many of these running at the same time, Jenkins blips out and we cannot contact the web interface because when the CPU is pegged.. it basically crashes the master.
Here are details about my jenkins:
My jenkins is 100% current:
- Jenkins ver. 2.147
- Please note I did today accept the plugin updates described on https://github.com/jenkinsci/jep/blob/master/jep/210/README.adoc#abstract


- relates to
-
-

- Resolved
-
-
JENKINS-38381 [JEP-210] Optimize log handling in Pipeline and Durable Task
-

- Resolved
-
-
JENKINS-56851 Flush durable task output before agent shutdown or before writing lastLocation
-
- Open
-
- links to
[JENKINS-54073] "Pipeline: Job" plugin causes Jenkins Master CPU to peg to ~100% during pipelines with parallel steps
 Jon B
added a comment - I suspect this might relate to JENKINS-38381 Jon B
added a comment - oleg_nenashev I have updated this ticket with more accurate information
Jon B
added a comment - I suspect this might relate to JENKINS-38381 Jon B
added a comment - oleg_nenashev I have updated this ticket with more accurate information  Sam Van Oort
added a comment -
Sam Van Oort
added a comment - piratejohnny Please attach a thread dump so that we can see what is happening while the CPU is running hot. Thanks!
Sam Van Oort
added a comment - piratejohnny Please attach a thread dump so that we can see what is happening while the CPU is running hot. Thanks! Jon B
added a comment - I just reverted the "Pipeline: Job" plugin back to the previous version and now the master CPU is not pegging. The same pipeline performance that I screenshotted above now looks like this:

Much better looking.. clearly not pegging.
I tried to generate a support bundle, but the CPU was so pegged that the request to generate the bundle times out.
It seems version 2.25 of "Pipeline: Job" is a much more performant version, at least in my complex case.

Jon B
added a comment - I just reverted the "Pipeline: Job" plugin back to the previous version and now the master CPU is not pegging. The same pipeline performance that I screenshotted above now looks like this:
Much better looking.. clearly not pegging.
I tried to generate a support bundle, but the CPU was so pegged that the request to generate the bundle times out.
It seems version 2.25 of "Pipeline: Job" is a much more performant version, at least in my complex case.
The minimum needed to diagnose this would be a thread dump. Even if the support-core plugin is not working, you can generate one manually with jstack (using -f if necessary). Of course better would be a reproducible test case, but sometimes hints can be gleaned without one.
Sam Van Oort
added a comment - I tried to reproduce this in my special-sauce loadtesting environment for Pipeline with lots of parallels (up to 100), and with parallels that do a lot of logging.
For future reference (and my own records), testing was done with testcases MassivelyParallelNodes, ParallelsPlusSteps, ParallelsPlusStepsRealisticSlowed, and continuous-looping run of DeclarativeParallels (1 concurrent build).
Looks like we're really going to need more detail to ID the problem here – a thread dump while load is high, and preferably a simple Pipeline that will reproduce the issue.
Sam Van Oort
added a comment - I tried to reproduce this in my special-sauce loadtesting environment for Pipeline with lots of parallels (up to 100), and with parallels that do a lot of logging.
For future reference (and my own records), testing was done with testcases MassivelyParallelNodes, ParallelsPlusSteps, ParallelsPlusStepsRealisticSlowed, and continuous-looping run of DeclarativeParallels (1 concurrent build).
Looks like we're really going to need more detail to ID the problem here – a thread dump while load is high, and preferably a simple Pipeline that will reproduce the issue. Happy to help.. the soonest I could do this would be tonight. Spent all of my energy last night diagnosing the pegged cpu... I'll post the jstack ouput as soon as I am able to.
Jon B
added a comment - - edited Happy to help.. the soonest I could do this would be tonight. Spent all of my energy last night diagnosing the pegged cpu... I'll post the jstack ouput as soon as I am able to.  kutzi
added a comment -
kutzi
added a comment - I think I've experienced the same issue. CPU dropped to normal levels after downgrade to 2.25
I've attached a thread dump
kutzi
added a comment - I think I've experienced the same issue. CPU dropped to normal levels after downgrade to 2.25
I've attached a thread dump  Lars Bilke
added a comment -
Lars Bilke
added a comment - I had this same issue with " Pipeline: Job" 2.26. Even my slaves randomly disconnected with "
script apparently exited with code 0 but asynchronous notification was lost". Reverting back to 2.25 solves the problem for me too.
Lars Bilke
added a comment - I had this same issue with " Pipeline: Job" 2.26. Even my slaves randomly disconnected with "
script apparently exited with code 0 but asynchronous notification was lost". Reverting back to 2.25 solves the problem for me too. kutzi looking over your thread dump, I see a ton of things going on, and it is far from clear which thread is consuming significant CPU. Besides threads clearly just waiting for something to happen on an agent, there are a bunch handling Remoting channels, some doing CPU work, some apparently waiting for /dev/random (try installing haveged or start with -Djava.security.egd=file:/dev/./urandom), some servicing Blue Ocean, one a performance problem apparently introduced by SECURITY-897 (CC wfollonier), a few actually writing log text (hence clearly related to this upgrade), some processing Pipeline Groovy script, some filling in the stack traces for InterruptedException (?), one active in the PubSub plugin (whatever that is—maybe related to Blue Ocean), one writing to the system log.
Can you use (e.g.) top to identify the actual threads responsible for most of the load? Or grab a series of thread dumps before and after the update? Or attach a support-core bundle that includes better diagnostics?
I can try enabling buffering on the log stream on the hypothesis that this is the culprit and offer a plugin update for that. Give me an hour or so.
Sam Van Oort
added a comment - kutzi One question: how many FlowNodes are in your build here?
Not clear exactly where the bottleneck is here, but a few observations for jglick
- There seems to be a lot of remoting-related activity running, both de/serialization and crypto
- The monitoring thread for free disk space is blocking 4 other threads, locking on the ConsoleHandler
- We have 5 separate threads trying to do FileLogStorage operations (two blocked by others)
These come up in stack traces for those:
at org.jenkinsci.plugins.workflow.log.FileLogStorage$IndexOutputStream.write(FileLogStorage.java:163)
at org.jenkinsci.plugins.workflow.log.FileLogStorage$IndexOutputStream.write(FileLogStorage.java:161)
Sam Van Oort
added a comment - kutzi One question: how many FlowNodes are in your build here?
Not clear exactly where the bottleneck is here, but a few observations for jglick
There seems to be a lot of remoting-related activity running, both de/serialization and crypto
The monitoring thread for free disk space is blocking 4 other threads, locking on the ConsoleHandler
We have 5 separate threads trying to do FileLogStorage operations (two blocked by others)
These come up in stack traces for those:
at org.jenkinsci.plugins.workflow.log.FileLogStorage$IndexOutputStream.write(FileLogStorage.java:163)
at org.jenkinsci.plugins.workflow.log.FileLogStorage$IndexOutputStream.write(FileLogStorage.java:161) Yes I am already experimenting with IndexOutputStream.write changes, though it is unclear whether this is actually the issue. Regarding the heavy Remoting activity, I also noted this; the only practical way to see whether that activity is reasonable or not is to install the support-core plugin and grab a bundle, which would include a summary of Remoting packets. This would also answer the question of how many FlowNode s are present in typical builds, not something a user could be expected to understand.
kutzi
added a comment - svanoort what are FlowNodes?
jglick I've already downgraded the plugin, again, and cannot get the info you requested, anymore. As this is a production-critical instance, I won't be able to set up a test case with the new plugin version in a short timeframe.
kutzi
added a comment - svanoort what are FlowNodes?
jglick I've already downgraded the plugin, again, and cannot get the info you requested, anymore. As this is a production-critical instance, I won't be able to set up a test case with the new plugin version in a short timeframe. kutzi understood, and thanks for the thread dump—while it is not sufficient to conclusively diagnose the issue, it at least offers some hints.
To anyone interested in trying an experimental patch, please install this update and let me know if it helps.
It would also be interesting to know whether setting the JVM option -Dorg.jenkinsci.plugins.workflow.steps.durable_task.DurableTaskStep.USE_WATCHING=false has any apparent effect. If so, this would mean that there is a performance issue with watch mode, perhaps caused by more frequent transmission of stdout packets from sh steps, which could presumably be tweaked in various ways: decreasing the log check frequency (currently hard-coded at 100ms); collecting all output into a memory buffer on the agent side and changing DurableTaskStep.HandlerImpl to do a single ProxyOutputStream.write call, letting it choose a potentially larger window size (Channel.PIPE_WINDOW_SIZE 1Mb?) than the 4k used by IOUtils.copy.
On the other hand, this update has been released for weeks and is active even without the rest of JEP-210 (it just means the stdout would get directed a little differently on the master side, after receiving the packets); and the streaming mode used by the now-default watch system is much closer to how freestyle builds have always sent stdout.
Decided to pull this from the update center pending better diagnostics. If we could pinpoint the root cause of the CPU usage, I suspect I could offer a fix the same day, but so far we have not gotten enough data.
Sam Van Oort
added a comment - CC danielbeck – the PR to pull this from the update center is https://github.com/jenkins-infra/update-center2/pull/247
Sam Van Oort
added a comment - CC danielbeck – the PR to pull this from the update center is https://github.com/jenkins-infra/update-center2/pull/247 Sam Van Oort
added a comment - piratejohnny bilke kutzi We've pulled this from the update center, but still would badly like to solve this bug. In order to try to resolve this, we're asking if you could supply as much information as you feel comfortable about the builds that were running at the time the problem manifested. Specifically, if there's any way you could be persuaded to upload a ZIP / tar.gz of the build folder for those builds (appropriately censored), it would be extremely helpful.
Especially helpful: the Pipeline and Shared Library code run, the 'workflow' subdirectory (contains XML files describing the build's step structure), the log file for the builds, and the log-index file for the build (both inside the build directory).
Sam Van Oort
added a comment - piratejohnny bilke kutzi We've pulled this from the update center, but still would badly like to solve this bug. In order to try to resolve this, we're asking if you could supply as much information as you feel comfortable about the builds that were running at the time the problem manifested. Specifically, if there's any way you could be persuaded to upload a ZIP / tar.gz of the build folder for those builds (appropriately censored), it would be extremely helpful.
Especially helpful: the Pipeline and Shared Library code run, the 'workflow' subdirectory (contains XML files describing the build's step structure), the log file for the builds, and the log-index file for the build (both inside the build directory). svanoort Someone on our security team advised me to take caution with respect to posting a thread dump from our Jenkins. Is there some way for me to share this privately such that the thread dump is not viewable to the public internet? I would try to open the dump files and scrape out anything that looks scary by hand but I'd much prefer to not post it publicly.
Jon B
added a comment - - edited svanoort Someone on our security team advised me to take caution with respect to posting a thread dump from our Jenkins. Is there some way for me to share this privately such that the thread dump is not viewable to the public internet? I would try to open the dump files and scrape out anything that looks scary by hand but I'd much prefer to not post it publicly. Sam Van Oort
added a comment - piratejohnny Yes, we can understand the potential security concerns (though they're less than with overall build).
With those concerns in mind, you can email the thread dump in private to Jesse and I (svanoort@cloudbees.com and jglick@cloudbees.com). We'd appreciate any other information you can supply (the workflow subfolder of the build above, Pipeline scripts, etc). Thanks!
Sam Van Oort
added a comment - piratejohnny Yes, we can understand the potential security concerns (though they're less than with overall build).
With those concerns in mind, you can email the thread dump in private to Jesse and I (svanoort@cloudbees.com and jglick@cloudbees.com). We'd appreciate any other information you can supply (the workflow subfolder of the build above, Pipeline scripts, etc). Thanks! By the way if you are able to create a support bundle using the support-core plugin, which includes thread dumps as well as many other things (as you choose), it attempts to anonymize any strings appearing in text files that look like job names etc. But yes, feel free to send any files privately.
I uploaded a build directory of an affected build run:
Maybe I can provide some more info next week ..
Lars Bilke
added a comment - - edited I uploaded a build directory of an affected build run:
https://d.pr/f/vz7Gjk+
Maybe I can provide some more info next week .. Sam Van Oort
added a comment - Thanks bilke – digging in, it seems this has pointed to the problem: we have a bug here with the log indexing, which for parallel steps it is showing parallels running shell steps is switching from one branch to another with just a few bytes of log at a time.
My suspicion for jglick is that we have a combination of the Controller.watch API (which sends logs from a shell step in 100 ms slices) plus the indexing which is trying to index with each of these mini-slices of log. The crude solution would be to set up so we're sending logs from the Shell/Batch/Powershell steps less frequently (say, every 5s or so). This would greatly reduce the interleaving. For controller.watch without the log handling rewrite, this probably wasn't as much of an issue because the log data came in larger batches.
We could also consider trying to buffer and consolidate those writes (at either end) but I suspect that will be considerably more complex to do correctly.
Sam Van Oort
added a comment - Thanks bilke – digging in, it seems this has pointed to the problem: we have a bug here with the log indexing, which for parallel steps it is showing parallels running shell steps is switching from one branch to another with just a few bytes of log at a time.
My suspicion for jglick is that we have a combination of the Controller.watch API (which sends logs from a shell step in 100 ms slices) plus the indexing which is trying to index with each of these mini-slices of log. The crude solution would be to set up so we're sending logs from the Shell/Batch/Powershell steps less frequently (say, every 5s or so). This would greatly reduce the interleaving. For controller.watch without the log handling rewrite, this probably wasn't as much of an issue because the log data came in larger batches.
We could also consider trying to buffer and consolidate those writes (at either end) but I suspect that will be considerably more complex to do correctly. svanoort I was about to write a similar comment with the same suspicions, (but thankfully refreshed the page before doing so!), and I agree that decreasing the check frequency here as you suggest seems like it would help. I think the ideal solution would be to buffer the logs on the remote end in durable-task and send them across the wire at line boundaries where possible, but as you said, that seems significantly more complicated to get right.
Buffering at least to EOLs does not seem like it should be too hard. (You still need to send partial lines eventually.) And there are probably other sorts of tuning which could help here. First I need to analyze the attachments and see if I can devise a test case showing similar symptoms.
Sam Van Oort
added a comment - jglick I'm working up a Hydra case for this – I think I have a pretty good idea why it didn't get reproduced before (log streaming from shell steps wasn't running for long enough in parallel, I believe).
Sam Van Oort
added a comment - jglick I'm working up a Hydra case for this – I think I have a pretty good idea why it didn't get reproduced before (log streaming from shell steps wasn't running for long enough in parallel, I believe). Can this problem also result in a huge spike of the "Computer.threadPoolForRemoting" threads (like thousands of them)? Because with the upgrade we had a huge spike of those threads and resulting in OOM as the 30k threads limit was reached. After downgrading again this problem disappears.
We're running with around 60 slaves (both windows jnlp and linux ssh mixed) and have lots of pipeline jobs with lots of parallel stuff.
 Patrick Ruckstuhl
added a comment - - edited Can this problem also result in a huge spike of the "Computer.threadPoolForRemoting" threads (like thousands of them)? Because with the upgrade we had a huge spike of those threads and resulting in OOM as the 30k threads limit was reached. After downgrading again this problem disappears.
We're running with around 60 slaves (both windows jnlp and linux ssh mixed) and have lots of pipeline jobs with lots of parallel stuff. Sam Van Oort
added a comment -
Patrick Ruckstuhl
added a comment - - edited Can this problem also result in a huge spike of the "Computer.threadPoolForRemoting" threads (like thousands of them)? Because with the upgrade we had a huge spike of those threads and resulting in OOM as the 30k threads limit was reached. After downgrading again this problem disappears.
We're running with around 60 slaves (both windows jnlp and linux ssh mixed) and have lots of pipeline jobs with lots of parallel stuff. Sam Van Oort
added a comment - tario It sounds very plausible for me, though I'd have to double check the code responsible.
Sam Van Oort
added a comment - tario It sounds very plausible for me, though I'd have to double check the code responsible. Can this problem also result in a huge spike of the "Computer.threadPoolForRemoting" threads (like thousands of them)?
I have not seen that and do not know offhand of a reason why there would be such a spike. If true, that would certainly explain other symptoms.
bilke your issue, at least, seems related to use of the timestamps step. See the proposed patch in JENKINS-48344. I will dig into why that would cause a regression (performance was always bad).
I see some issues when I compare Remoting behavior (even in a single thread) to that of a freestyle build. There are Pipe.Flush es, which should not be necessary; the Pipe.Chunk s are ~200b, rather than ~4Kb; there are long sequences of ProxyOutputStream.Ack s. I suspect the problem here is not so much with the granularity of output being produced by the durable task—changing this to, say, sending a single byte array every three seconds makes no difference from the Remoting perspective, except that the burst of little commands comes only every three seconds—as that when you have any sort of console decorator using LineTransformationOutputStream (such as when using timestamps either before or after my fix), the output becomes heavily fragmented. Therefore I am considering some sort of buffering as a final wrapper before using the stream remoting offered by StreamTaskListener.
Actually if I correct the freestyle build script to
set +x
cat /dev/urandom | env LC_CTYPE=c tr -dc '[:alpha:]\n' | awk '{print ENVIRON["BRANCH"], $0; system("sleep .1");}'
then it produces small chunks, typically around 300b apiece, with one ack per chunk. In 2.138.x there are also flushes, which I think is an unintentional side effect of my fix of JENKINS-52729: StreamTaskListener turns on autoflush when remoted, for no apparent reason. If I disable that in Pipeline, I can get rid of flushes, and if I apply buffering, I can greatly reduce Remoting overhead.
Patrick Ruckstuhl
added a comment - Problem still occurs for me. After starting a couple of jobs which run some parallel stuff I'm getting a huge number of "Computer.threadPoolForRemoting" threads until it reaches 30k and then everything breaks down.
After the first OOM I see lots of errors like
SEVERE: This command is created here
Command UserRequest:org.jenkinsci.plugins.workflow.steps.TimeoutStepExecution$ResetTimer@7e26e8e5 created at
        at hudson.remoting.Command.<init>(Command.java:79)
        at hudson.remoting.Request.<init>(Request.java:112)
        at hudson.remoting.Request.<init>(Request.java:107)
        at hudson.remoting.UserRequest.<init>(UserRequest.java:77)
        at hudson.remoting.Channel.callAsync(Channel.java:985)
        at org.jenkinsci.plugins.workflow.steps.TimeoutStepExecution$ConsoleLogFilterImpl$1.eol(TimeoutStepExecution.java:288)
        at hudson.console.LineTransformationOutputStream.eol(LineTransformationOutputStream.java:60)
        at hudson.console.LineTransformationOutputStream.write(LineTransformationOutputStream.java:56)
        at hudson.console.LineTransformationOutputStream.write(LineTransformationOutputStream.java:74)
        at org.jenkinsci.plugins.pipeline.maven.console.MaskSecretsOutputStream.eol(MaskSecretsOutputStream.java:36)
        at hudson.console.LineTransformationOutputStream.eol(LineTransformationOutputStream.java:60)
        at hudson.console.LineTransformationOutputStream.write(LineTransformationOutputStream.java:56)
        at hudson.console.LineTransformationOutputStream.write(LineTransformationOutputStream.java:74)
        at hudson.tasks._maven.MavenConsoleAnnotator.eol(MavenConsoleAnnotator.java:75)
        at hudson.console.LineTransformationOutputStream.eol(LineTransformationOutputStream.java:60)
        at hudson.console.LineTransformationOutputStream.write(LineTransformationOutputStream.java:56)
        at hudson.console.LineTransformationOutputStream.write(LineTransformationOutputStream.java:74)
        at org.apache.commons.io.IOUtils.copyLarge(IOUtils.java:1793)
        at org.apache.commons.io.IOUtils.copyLarge(IOUtils.java:1769)
        at org.apache.commons.io.IOUtils.copy(IOUtils.java:1744)
        at org.jenkinsci.plugins.workflow.steps.durable_task.DurableTaskStep$HandlerImpl.output(DurableTaskStep.java:582)
        at org.jenkinsci.plugins.durabletask.FileMonitoringTask$Watcher.run(FileMonitoringTask.java:477)
        at java.util.concurrent.Executors$RunnableAdapter.call(Unknown Source)
        at java.util.concurrent.FutureTask.run(Unknown Source)
        at java.util.concurrent.ScheduledThreadPoolExecutor$ScheduledFutureTask.access$201(Unknown Source)
        at java.util.concurrent.ScheduledThreadPoolExecutor$ScheduledFutureTask.run(Unknown Source)
        at java.util.concurrent.ThreadPoolExecutor.runWorker(Unknown Source)
        at java.util.concurrent.ThreadPoolExecutor$Worker.run(Unknown Source)
        at java.lang.Thread.run(Unknown Source)
I'm wondering if the fact that we're wrapping our jobs with a
timeout(activity: true, time: 2, unit: 'HOURS') {
could be involved in this as well (as I guess this has to reset a counter on each log output).
Another thing is that a couple of seconds before it runs out of threads I see a huge number of messages like
Oct 25, 2018 8:24:18 AM org.jenkinsci.plugins.workflow.flow.FlowExecutionList unregister
WARNING: Owner[Core Mainline Status/PR-2684/1058:Core Mainline Status/PR-2684 #1058] was not in the list to begin with: [Owner[Core Integration/PR-2968/6:Core Integration/PR-2968 #6], Owner[Core Acceptance Installer/release%2F18_1_x/52:Core Acceptance Installer/release%2F18_1_x #52], Owner[Core Acceptance Installer/master/79:Core Acceptance Installer/master #79], Owner[Core Performance/master/30:Core Performance/master #30], .......]
Patrick Ruckstuhl
added a comment - Problem still occurs for me. After starting a couple of jobs which run some parallel stuff I'm getting a huge number of "Computer.threadPoolForRemoting" threads until it reaches 30k and then everything breaks down.
After the first OOM I see lots of errors like
SEVERE: This command is created here
Command UserRequest:org.jenkinsci.plugins.workflow.steps.TimeoutStepExecution$ResetTimer@7e26e8e5 created at
at hudson.remoting.Command.<init>(Command.java:79)
at hudson.remoting.Request.<init>(Request.java:112)
at hudson.remoting.Request.<init>(Request.java:107)
at hudson.remoting.UserRequest.<init>(UserRequest.java:77)
at hudson.remoting.Channel.callAsync(Channel.java:985)
at org.jenkinsci.plugins.workflow.steps.TimeoutStepExecution$ConsoleLogFilterImpl$1.eol(TimeoutStepExecution.java:288)
at hudson.console.LineTransformationOutputStream.eol(LineTransformationOutputStream.java:60)
at hudson.console.LineTransformationOutputStream.write(LineTransformationOutputStream.java:56)
at hudson.console.LineTransformationOutputStream.write(LineTransformationOutputStream.java:74)
at org.jenkinsci.plugins.pipeline.maven.console.MaskSecretsOutputStream.eol(MaskSecretsOutputStream.java:36)
at hudson.console.LineTransformationOutputStream.eol(LineTransformationOutputStream.java:60)
at hudson.console.LineTransformationOutputStream.write(LineTransformationOutputStream.java:56)
at hudson.console.LineTransformationOutputStream.write(LineTransformationOutputStream.java:74)
at hudson.tasks._maven.MavenConsoleAnnotator.eol(MavenConsoleAnnotator.java:75)
at hudson.console.LineTransformationOutputStream.eol(LineTransformationOutputStream.java:60)
at hudson.console.LineTransformationOutputStream.write(LineTransformationOutputStream.java:56)
at hudson.console.LineTransformationOutputStream.write(LineTransformationOutputStream.java:74)
at org.apache.commons.io.IOUtils.copyLarge(IOUtils.java:1793)
at org.apache.commons.io.IOUtils.copyLarge(IOUtils.java:1769)
at org.apache.commons.io.IOUtils.copy(IOUtils.java:1744)
at org.jenkinsci.plugins.workflow.steps.durable_task.DurableTaskStep$HandlerImpl.output(DurableTaskStep.java:582)
at org.jenkinsci.plugins.durabletask.FileMonitoringTask$Watcher.run(FileMonitoringTask.java:477)
at java.util.concurrent.Executors$RunnableAdapter.call(Unknown Source)
at java.util.concurrent.FutureTask.run(Unknown Source)
at java.util.concurrent.ScheduledThreadPoolExecutor$ScheduledFutureTask.access$201(Unknown Source)
at java.util.concurrent.ScheduledThreadPoolExecutor$ScheduledFutureTask.run(Unknown Source)
at java.util.concurrent.ThreadPoolExecutor.runWorker(Unknown Source)
at java.util.concurrent.ThreadPoolExecutor$Worker.run(Unknown Source)
at java.lang. Thread .run(Unknown Source)
I'm wondering if the fact that we're wrapping our jobs with a
timeout(activity: true , time: 2, unit: 'HOURS' ) {
could be involved in this as well (as I guess this has to reset a counter on each log output).
Another thing is that a couple of seconds before it runs out of threads I see a huge number of messages like
Oct 25, 2018 8:24:18 AM org.jenkinsci.plugins.workflow.flow.FlowExecutionList unregister
WARNING: Owner[Core Mainline Status/PR-2684/1058:Core Mainline Status/PR-2684 #1058] was not in the list to begin with: [Owner[Core Integration/PR-2968/6:Core Integration/PR-2968 #6], Owner[Core Acceptance Installer/release%2F18_1_x/52:Core Acceptance Installer/release%2F18_1_x #52], Owner[Core Acceptance Installer/master/79:Core Acceptance Installer/master #79], Owner[Core Performance/master/30:Core Performance/master #30], .......]
Lars Bilke
added a comment - For me the fix works so far. No problems. We also use timeout() but without the activity argument.
Thanks a lot!
Lars Bilke
added a comment - For me the fix works so far. No problems. We also use timeout() but without the activity argument.
Thanks a lot! Patrick Ruckstuhl
added a comment - Maybe also important, we're on LTS 2.138.2 tario you seem to have a distinct issue from everyone else. I suspect there is something amiss in my fix of JENKINS-54078 specific to using activity: true.
Patrick Ruckstuhl
added a comment - Ok, could very well be as I had to install your patch as otherwise nothing was working.
Patrick Ruckstuhl
added a comment - Ok, could very well be as I had to install your patch as otherwise nothing was working. A fix for this was just released in version 2.31 of the Pipeine API Plugin. (Note that this bug should only affect you if you are running workflow-job 2.26)
Jon B
added a comment - Sorry for having disappeared on this jira.. I will upgrade this plugin tonight and rerun my pipeline to see if it still pegs the cpu to 100% and confirm by tomorrow. Thank you for your hard work on this!
Jon B
added a comment - Sorry for having disappeared on this jira.. I will upgrade this plugin tonight and rerun my pipeline to see if it still pegs the cpu to 100% and confirm by tomorrow. Thank you for your hard work on this! Jon B
added a comment - Question: I see this message: "2.27 (2018 Nov 01) - WARNING: Although major issues have been fixed since 2.26, this version carries extra risk and is not fully backwards compatible with 2.25 or older; consider waiting a few days to update in critical environments."
If I upgrade my plugins and it pegs to 100% cpu again, will I be able to downgrade back to a healthy state with the jenkins downgrade option? Or, should I snapshot my master just in case i have to do a full restore of the master?
Jon B
added a comment - Question: I see this message: "2.27 (2018 Nov 01) - WARNING: Although major issues have been fixed since 2.26, this version carries extra risk and is not fully backwards compatible with 2.25 or older; consider waiting a few days to update in critical environments."
If I upgrade my plugins and it pegs to 100% cpu again, will I be able to downgrade back to a healthy state with the jenkins downgrade option? Or, should I snapshot my master just in case i have to do a full restore of the master? piratejohnny I would always encourage you to back up your master before updating plugins just in case. As far as I am aware, the compatibility notice is because if you downgrade from workflow-job 2.26 or 2.27 back to 2.25 or older, the per-step logs for builds you ran in versions 2.26-2.27 will be unreadable, the full build log will be viewable but its formatting will be a little messed up, and any in-progress builds will fail, although I have not specifically tested a downgrade to be aware of all potential issues.

Hi. It is not analyzable without Jenkins version and thread CPU usage stats.
You can use tools like jvmtop to retrieve the JVM stats