Similar issue for us, but not on the main page.
For us, it's the job configuration page for Pipeline and Maven jobs. Every access of the configure page takes anything between 30 and 120 seconds to load.
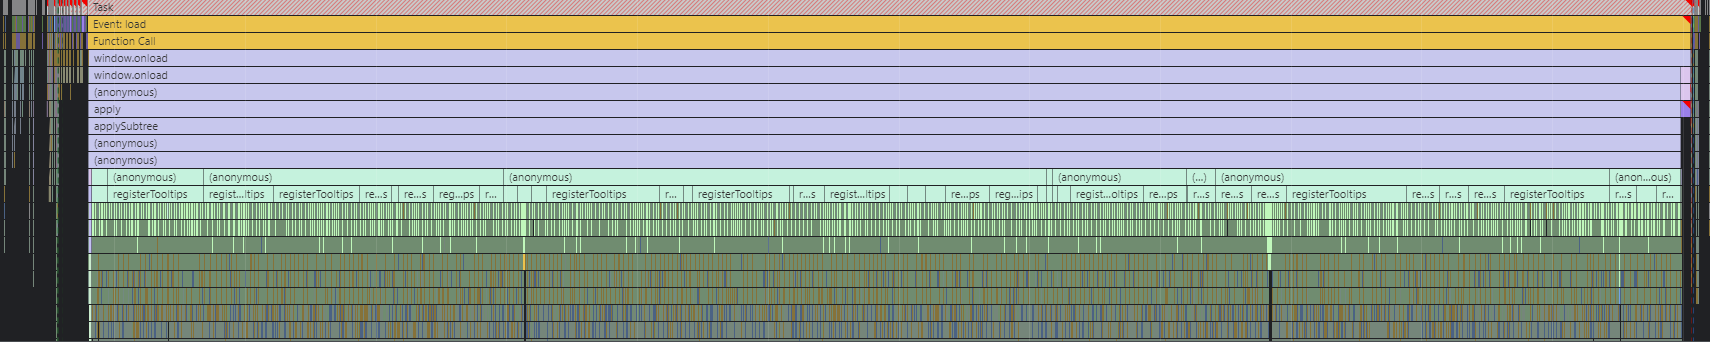
Maybe (can't verify though) it's our quite extensive use of the Matrix Authorization Strategy Plugin which creates tables with lots of tooltips. But at least for a few projects where we don't use that, it's much faster (but still slower than expected). I've tried to use the Chrome DevTools profiler to make a recording but it seems to be overwhelmed and doesn't show a report. I'm not a webdev either, so that would probably not be too helpful anyway.
Edit: Uh, performance rendering came back.


My guess: it's related to Tippy and GC.
Edit2: Can confirm that downgrade to 2.379 fixes it.
I'd suggest raising the severity to Critical or even Blocker, as it forces people to downgrade.
Bug
 Major
Major


 Stephan Senkbeil
created issue -
Stephan Senkbeil
created issue -
 Alexander Brandes
made changes -
Alexander Brandes
made changes -
Similar issue for us, but not on the main page.
For us, it's the job configuration page for Pipeline and Maven jobs. Every access of the configure page takes anything between 30 and 120 seconds to load.
Maybe (can't verify though) it's our quite extensive use of the Matrix Authorization Strategy Plugin which creates tables with lots of tooltips. But at least for a few projects where we don't use that, it's much faster (but still slower than expected). I've tried to use the Chrome DevTools profiler to make a recording but it seems to be overwhelmed and doesn't show a report. I'm not a webdev either, so that would probably not be too helpful anyway.
Edit: Uh, performance rendering came back.
My guess: it's related to Tippy and GC.
Edit2: Can confirm that downgrade to 2.379 fixes it.
I'd suggest raising the severity to Critical or even Blocker, as it forces people to downgrade.