-
Bug
-
Resolution: Fixed
-
 Major
Major
-
None
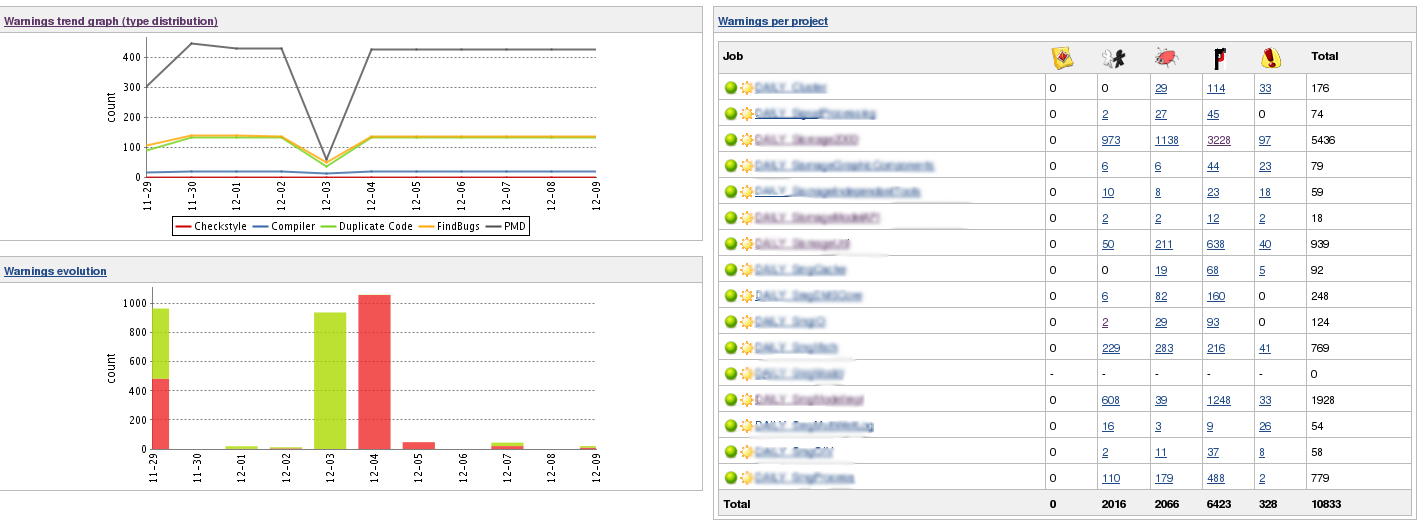
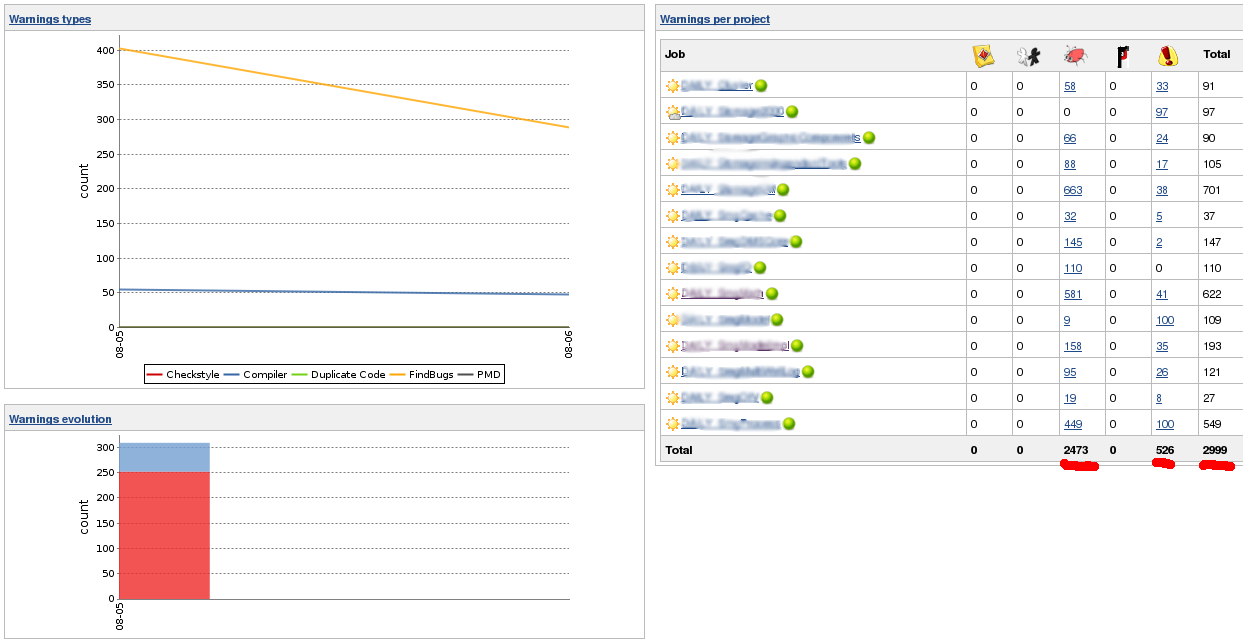
The trend "Warnings trend graph (type distribution)" in a Dashboard view displays average count instead of sum.
Example:
I have 2 Jobs, one has 50 findbugs warnings, the other 200.
If I put both of them in a dashboard view with a Portlet "Warnings trend graph (type distribution)" the count displayed is 125 instead of 250.
I don't know if this is a bug or a rfe...
But it would be useful to display the sum instead of average in trends
NB:
In the "Warnings per project" portlet the total is 250.
This problem may exists for the other warnings kind (compiler: yes, pmd: ?, etc...)