-
Type:
Improvement
-
Resolution: Fixed
-
Priority:
 Minor
Minor
-
Component/s: core
-
Environment:Jenkins LTS 2.516.1
OpenIndiana Hipster (rolling release, installation updated early 2025)
Issue noted with JDK17, will update to JDK21 after a maintenance window:
openjdk version "17.0.13" 2024-10-15
OpenJDK Runtime Environment (build 17.0.13+0-adhoc..jdk17u-jdk-17.0.13-ga)
OpenJDK 64-Bit Server VM (build 17.0.13+0-adhoc..jdk17u-jdk-17.0.13-ga, mixed mode, sharing)
Browsing from Windows (Firefox) into pages that still have the side panel left, e.g. a $JENKINS_URL/fingerprintCheck - to view and manage the build queue (via Simple Queue Plugin built with https://github.com/jenkinsci/simple-queue-plugin/pull/18 PR sources).Jenkins LTS 2.516.1 OpenIndiana Hipster (rolling release, installation updated early 2025) Issue noted with JDK17, will update to JDK21 after a maintenance window: openjdk version "17.0.13" 2024-10-15 OpenJDK Runtime Environment (build 17.0.13+0-adhoc..jdk17u-jdk-17.0.13-ga) OpenJDK 64-Bit Server VM (build 17.0.13+0-adhoc..jdk17u-jdk-17.0.13-ga, mixed mode, sharing) Browsing from Windows (Firefox) into pages that still have the side panel left, e.g. a $JENKINS_URL/fingerprintCheck - to view and manage the build queue (via Simple Queue Plugin built with https://github.com/jenkinsci/simple-queue-plugin/pull/18 PR sources).
Originally discussed on Gitter:
- https://matrix.to/#/!HKutvjxPnajVyCNLhF:matrix.org/$1CZpaB7LVkmQ_5teEQYZ_3v7zJnnGHZ10A6ce1G90iI?via=gitter.im&via=matrix.org&via=mozilla.org
- https://matrix.to/#/!HKutvjxPnajVyCNLhF:matrix.org/$_2qS0nCdbqXNOvwW7LTPlOVKA3L6YQZ2uz2JiBQm0xU?via=gitter.im&via=matrix.org&via=mozilla.org
A Jenkins controller I manage was acting up lately, with very slow job processing. For context, they are massively parallel dynamic matrices for multi-platform/multi-toolkit/multi-standard builds, with hundreds of scenarios spread over a large population of build agents that were not doing much themselves this time, but having work assigned for hours. Progressing between pipeline steps (and/or I/O between agents and controller?) had significant delays. These builds do normally cost a few hours, but this time the ones running are half-done after more than a day spent (with no faults reported so far).
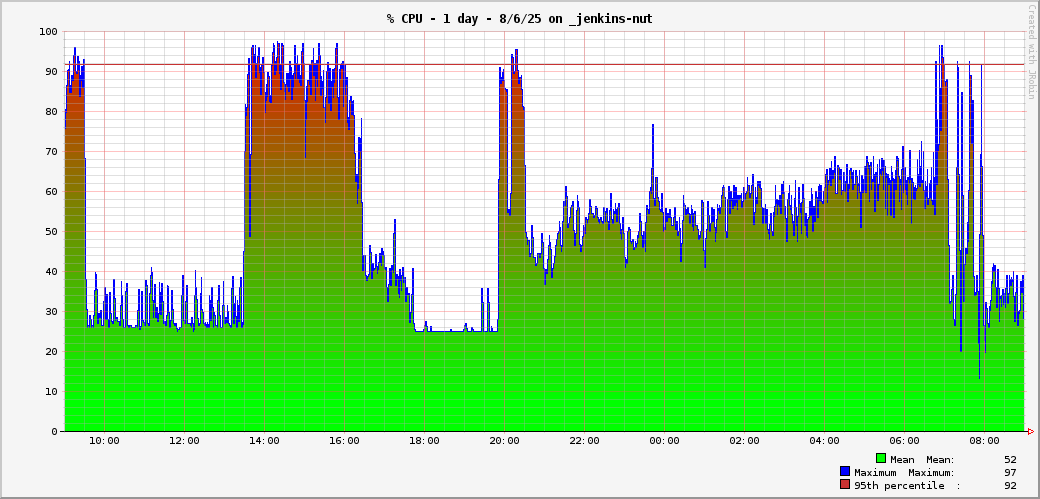
Looking at the server, I saw near-zero idle CPU time, and high kernel times. In top, the java process of the Jenkins controller claimed to be using all CPU (probably including the time it was blocked on kernel calls. Previously this behavior was associated with a nearly-full ZFS on the server (sadly known for performance tanking when free space is in small fragments, and kernel tries to find spots to write into or crush stuff into yet smaller pieces), but here this likely cause was ruled out.
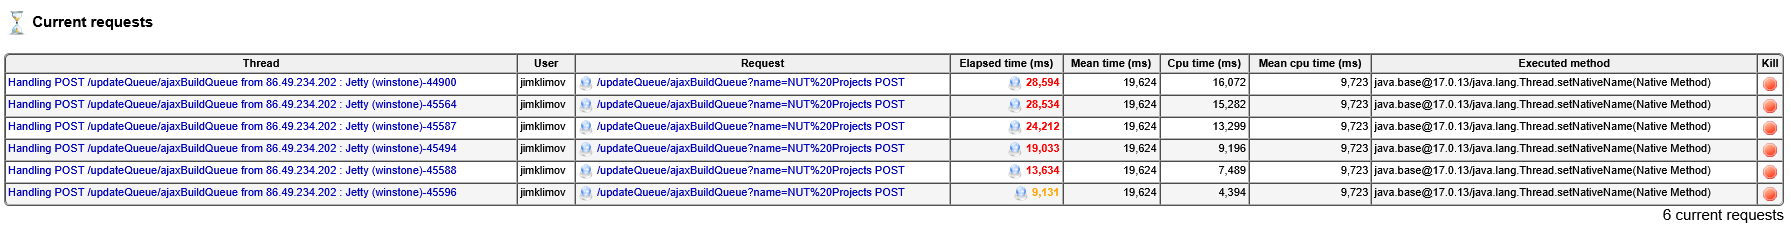
Now, the likely root cause seems the controller's OS taking a lot of time (not usual, reason unknown) to assign thread names. This apparently is not a frequent occurrence in pipeline job processing (maybe because the threads are long-lived, so their name was assigned some time ago), but it did pop up this time with HTTP query handling from the AJAX build queue auto-updates - these are apparently posted by the Web-UI from browser every 5 seconds, and with the work to produce the response (due to both thread name setting delay in kernel, and subsequent work in Java to process the query when hundreds of queue items are outstanding) exceeding that frequency, things pile up quickly.
This issue suggests following the lead of https://github.com/jenkinsci/pipeline-graph-view-plugin/pull/887 which separated query handling from the computations behind them - so effectively the HTTP queries that pile up due to external causes no longer burn CPU to each produce the same answer. Instead, a single call stack works on the expensive task now, and the HTTP query handlers are parked and waiting to pass on the same response to browsers. This way, numerous (auto-)posted queries for stuff that takes hard work to answer, do not cause DoS-style outage of the Jenkins server.
With AJAX auto-update of the build queue widget, possibly running in a background tab that nobody even sees, or auto-posted by different peoples' browsers, the Jenkins controller should not invest resources into an honest but costly individually tailored up-to-date answer for each such query. This point remains valid even when there is no external (kernel) overhead, but the queue size still makes the answer expensive.
- It should however tailor an up-to-date one when the page is fully reloaded, if possible.
Some observations follow:
- Closing the tab with the side panel seems to speed up the server by a lot. CPU time of the java process also drops when the queue is not refreshed, from 98+% down to 30-50% as needed for probably doing its primary job. There's actually significant idle time overall then.
- Fun fact: the machine hosting many of the build agents is under my desk. I hear the fans whirring up soon after the browser tab is closed and those ajax queries wither away - the controller gets time to actually distribute tasks to its workers

Which may also be or not be a hint about some deeper issue in the controller. Is "actual work" happening slower just because the controller server's CPU is busy (in kernel) and offers little time for anything else, or is there some lock about either handling pipeline logic or the HTTP queries at any given time?
- I wonder... if the root cause could be the kernel spinning to try and set thread names (taking longer than usual for whatever reason, probably some internal lock since they seem to flush in groups), would staggering the request processing help much? Can the query handling impact the thread-name setting, and when it happens (can we fiddle it to be set after we decide to call the single calculation, before parking)? In any case, caching a response for all those blocked queries to return would save at least some CPU time.
With the tab closed, I barely see any other threads trying to set a native name. Maybe they are just longer-lived though (so even if the kernel lags this for everyone, the actual build processing is not impacted now because its threads are already there and/or recycle rarely?)
The OS pstack does expose some fancy names (meaning other parts of Jenkins code do use them at some point), for example:
 ----- thread# 1721 / lwp# 1721 [GitHubPushTrigger [#2]] ------
 00007fffab8c7c47 lwp_park (0, 0, 0)
 00007fffab8c0fd5 cond_wait_queue (7370358, 7370340, 0) + 55
 00007fffab8c163a __cond_wait (7370358, 7370340) + ba
 00007fffab8c167e cond_wait (7370358, 7370340) + 2e
 00007fffa754bd92 _ZN6Parker4parkEbl () + e2
 00007fffa7806003 Unsafe_Park () + 163
 00007fff963b22d5 ???????? ()
 00007fff97104648 ???????? ()
 00000003010d6948 ???????? ()