Uploaded image for project: 'Jenkins'
  1. Jenkins
  2. JENKINS-38741

Job DSL execution is occassionally slow on large scale production servers

    XMLWordPrintable

Details

    • Bug
    • Status: Open (View Workflow)
    • Minor
    • Resolution: Unresolved
    • job-dsl-plugin
    • None
    • Jenkins 1.642.4
      Job DSL plugin v1.42

    Description

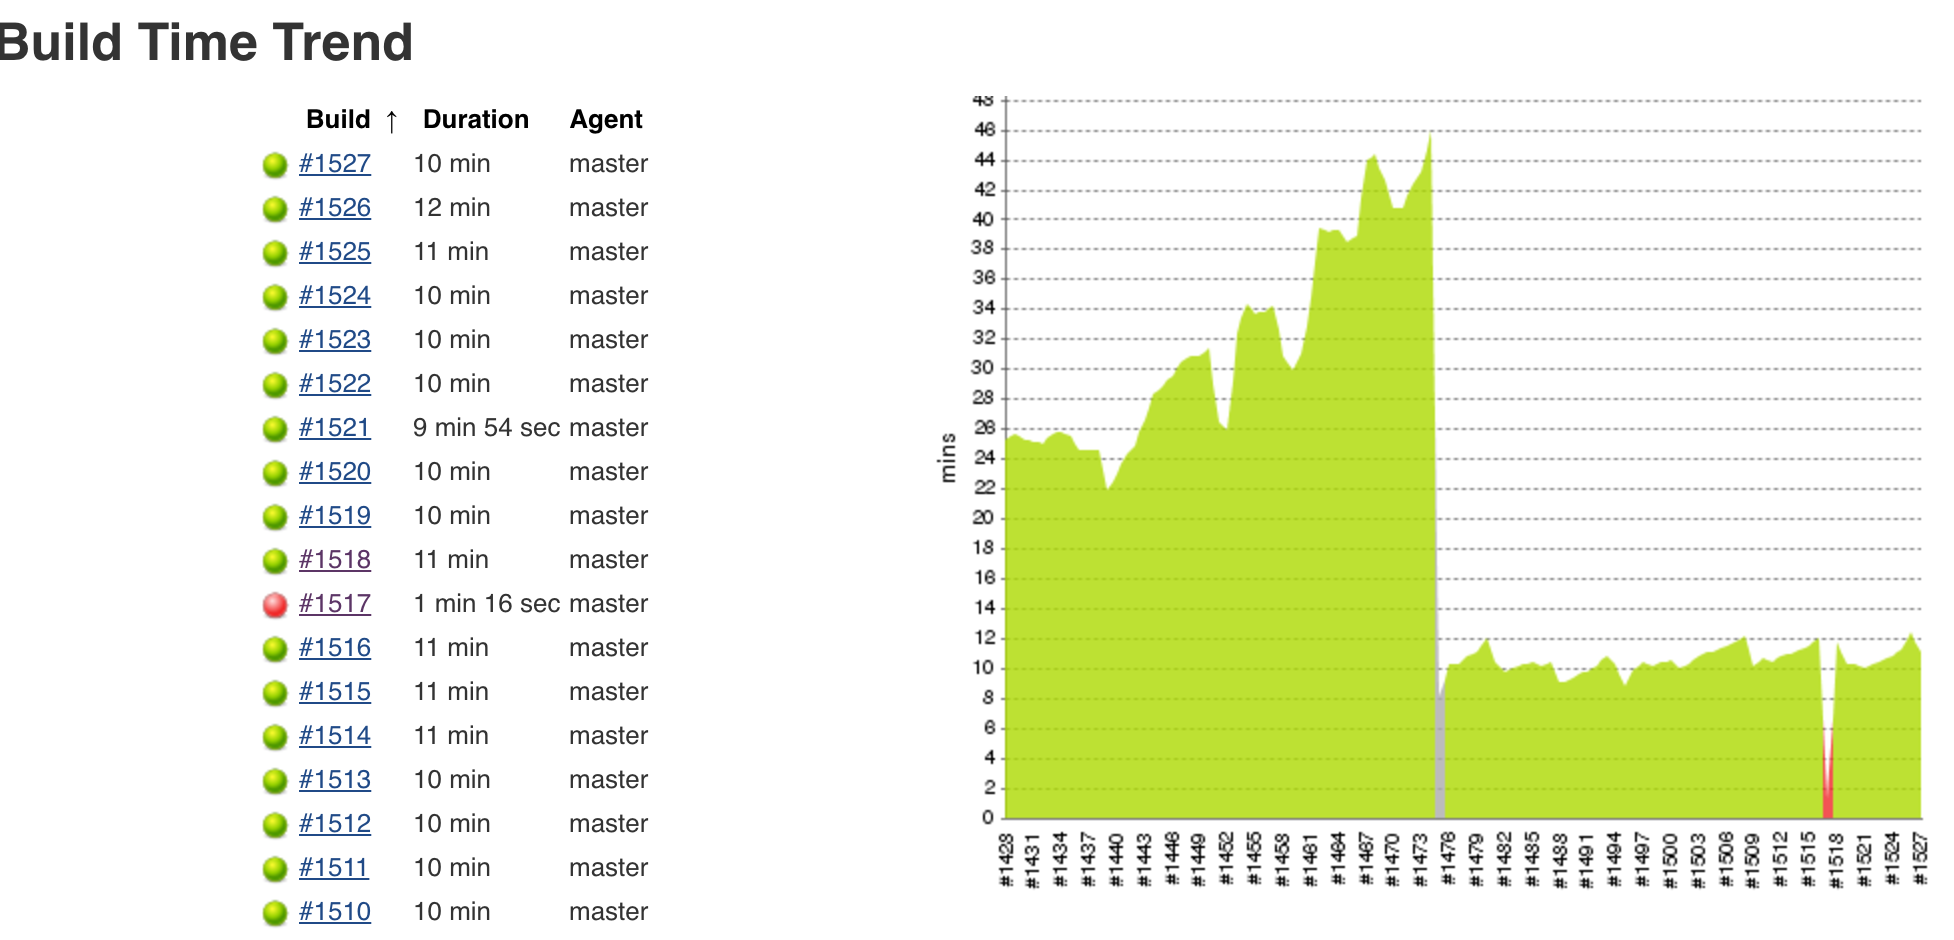
      We have several Jenkins jobs which do nothing more than execute a single build step for running job DSL code. Further, some of these scripts are responsible for dynamically generating hundreds of new jobs. Now, sometimes these scripts run through to completion quickly (ie: 60 seconds or less) but other times they take severely long periods of time to complete (ie: 20-30 minutes or more).

      Based on some crude investigations on my part trolling through build logs and poking around at the source code for the job DSL plugin, what I think it happening is that after the job DSL gets processed a list of newly generated and / or modified job configs are stored in memory and then the Jenkins master is 'scheduled' to run each of the individual job operations whenever it can. In these extreme situations it appears to take a very long period of time for all of these individual job operations (for which there are hundreds) to get scheduled and run. For example, when looking at the time stamps of specific log messages on the master we see it may be as much as 60 seconds from when one job update operation completes and the next one begins, with other unrelated output from the master in between.

      Why this happens exactly, I am not sure. The conditions causing the slowdown are difficult at best to reproduce. I can say that in our production environment the Jenkins master runs on a virtual machine with considerable resources assigned to it, and we don't have any executors configured on the master so any load it may see is 100% associated with the master processes and not some unpredictable build operation.

      If anyone can shed some light on why this behaves as it does, and whether there's anything we can do on our end to try and mitigate the issue that would be awesome. Also, it would be nice to see some sort of implementation change in the plugin itself to try and ensure the performance from the generation process is kept consistent between runs (ie: if all job configuration updates could be scheduled as a single larger operation instead of many smaller ones)

      Attachments

        Issue Links

          Activity

            ajmsh Anand Shah added a comment - - edited

            So it seems, limiting jobConfigHistory does not help much. I started taking heap dump every day to figure it out if there is any memory leak. I analyzed heap dumps in mat tool and I found two memory leaks as following.

            Problem Suspect 1

            106 instances of "hudson.remoting.Channel", loaded by "org.eclipse.jetty.webapp.WebAppClassLoader @ 0x400305b48" occupy 1,073,486,048 (40.31%) bytes.

            Biggest instances:

            hudson.remoting.Channel @ 0x4203a2778 - 98,671,000 (3.70%) bytes.
             

            Problem Suspect 2

            272,374 instances of "java.lang.Class", loaded by "<system class loader>" occupy 715,804,624 (26.88%) bytes.

            Biggest instances:

            • class java.beans.ThreadGroupContext @ 0x40504ed98 - 149,043,688 (5.60%) bytes.
            • class org.codehaus.groovy.reflection.ClassInfo @ 0x405037168 - 126,458,224 (4.75%) bytes.

            These instances are referenced from one instance of "org.codehaus.groovy.util.AbstractConcurrentMapBase$Segment[]", loaded by "org.eclipse.jetty.webapp.WebAppClassLoader @ 0x400305b48"
             

            Suspect 2 might be related to a memory leak in groovy itself.
            We are using job-dsl plugin version 1.47 and have "groovy-all-2.4.7.jar" under "WEB-INF/lib"
             
             Groovy Leak: https://issues.apache.org/jira/browse/GROOVY-7683
             
            As described in JENKINS-33358, setting -Dgroovy.use.classvalue=true might help.
             

            ajmsh Anand Shah added a comment - - edited So it seems, limiting jobConfigHistory does not help much. I started taking heap dump every day to figure it out if there is any memory leak. I analyzed heap dumps in mat tool and I found two memory leaks as following. Problem Suspect 1 106 instances of  "hudson.remoting.Channel" , loaded by  "org.eclipse.jetty.webapp.WebAppClassLoader @ 0x400305b48"  occupy  1,073,486,048 (40.31%)  bytes. Biggest instances: hudson.remoting.Channel @ 0x4203a2778 - 98,671,000 (3.70%) bytes.   Problem Suspect 2 272,374 instances of  "java.lang.Class" , loaded by  "<system class loader>"  occupy  715,804,624 (26.88%)  bytes. Biggest instances: class java.beans.ThreadGroupContext @ 0x40504ed98 - 149,043,688 (5.60%) bytes. class org.codehaus.groovy.reflection.ClassInfo @ 0x405037168 - 126,458,224 (4.75%) bytes. These instances are referenced from one instance of  "org.codehaus.groovy.util.AbstractConcurrentMapBase$Segment[]" , loaded by  "org.eclipse.jetty.webapp.WebAppClassLoader @ 0x400305b48"   Suspect 2 might be related to a memory leak in groovy itself. We are using job-dsl plugin version 1.47 and have "groovy-all-2.4.7.jar" under "WEB-INF/lib"    Groovy Leak: https://issues.apache.org/jira/browse/GROOVY-7683   As described in JENKINS-33358 , setting  -Dgroovy.use.classvalue=true might help.  
            treybohon Trey Bohon added a comment - - edited

            We're seeing a very similar linear increase on Job DSL execution time at my organization as Anand's. We also P4 SCM trigger all of our seeds (nearly 500 today) within 15 minutes. Each batch of these regens results in a single seed increasing about 0.5 seconds in execution time (starts around 6 seconds). Because our master has 12 executors, these 0.5 increments gradually result in these 500 batch regens taking 2+ hours instead of 15 minutes. Rebooting Jenkins resets this degradation.

            For this problem, I wouldn't call it "Job DSL execution is occassionally slow on large scale production servers" but instead something like "Job DSL execution time increases linearly with usage for a given Jenkins uptime instance". Our trendline looks very similar to the attached.

            I'm trying to narrow this down by generating a single job with an existing Groovy file on disk with enough seed jobs scheduled to run every minute such that all 12 executors are in use. It will take several hours to confirm it, but it appears to be leaking on our production master. It for sure doesn't on a dev machine with a very similar setup (it has been running for days, tens of thousands of seed runs). The only meaningful differences between the setups are the JDK build:
            Production:
            jdk1.8.0_131

            Dev Machine:
            1.8.0_112

            And the Java flags. Which I know are absolutely essential for a large production server - for example not setting InitiatingHeapOccupancyPercent to something like 70 with a G1 GC means you will run out of memory within hours or days depending on your setup.

            We're using Jenkins LTS 2.60.2 so that Groovy leak fix shouldn't be a factor.

            I'll post back when I have more data. If my debugging setup reproduces it, I think it throws out a lot of the XML mutation and job config history ideas because we're talking about 1 job that's generated with a mostly unchanging history over hours.

            I'd be open to a workaround by infrequent reboots as we generally have maintenance windows for OS updates and security weekly, which ultimately may be the realistic solution as the issue may be "Job DSL does something that causes something somewhere in Jenkins to leak".


            EDIT: And the linear trend on our production master reset.  I knew I posted this too soon.  Our production master has a massive heap (100 GB) whereas my dev machine does not, so maybe 2.60.2 does fix this (which we recently upgraded to) but with larger heaps it takes longer for GC to cleanup periodically.  I'm probably going to have to watch this over a couple of days to see if the data follows this behavior.

            treybohon Trey Bohon added a comment - - edited We're seeing a very similar linear increase on Job DSL execution time at my organization as Anand's. We also P4 SCM trigger all of our seeds (nearly 500 today) within 15 minutes. Each batch of these regens results in a single seed increasing about 0.5 seconds in execution time (starts around 6 seconds). Because our master has 12 executors, these 0.5 increments gradually result in these 500 batch regens taking 2+ hours instead of 15 minutes. Rebooting Jenkins resets this degradation. For this problem, I wouldn't call it "Job DSL execution is occassionally slow on large scale production servers" but instead something like "Job DSL execution time increases linearly with usage for a given Jenkins uptime instance". Our trendline looks very similar to the attached. I'm trying to narrow this down by generating a single job with an existing Groovy file on disk with enough seed jobs scheduled to run every minute such that all 12 executors are in use. It will take several hours to confirm it, but it appears to be leaking on our production master. It for sure doesn't on a dev machine with a very similar setup (it has been running for days, tens of thousands of seed runs). The only meaningful differences between the setups are the JDK build: Production: jdk1.8.0_131 Dev Machine: 1.8.0_112 And the Java flags. Which I know are absolutely essential for a large production server - for example not setting InitiatingHeapOccupancyPercent to something like 70 with a G1 GC means you will run out of memory within hours or days depending on your setup. We're using Jenkins LTS 2.60.2 so that Groovy leak fix shouldn't be a factor. I'll post back when I have more data. If my debugging setup reproduces it, I think it throws out a lot of the XML mutation and job config history ideas because we're talking about 1 job that's generated with a mostly unchanging history over hours. I'd be open to a workaround by infrequent reboots as we generally have maintenance windows for OS updates and security weekly, which ultimately may be the realistic solution as the issue may be "Job DSL does something that causes something somewhere in Jenkins to leak".   EDIT: And the linear trend on our production master reset.  I knew I posted this too soon.  Our production master has a massive heap (100 GB) whereas my dev machine does not, so maybe 2.60.2 does fix this (which we recently upgraded to) but with larger heaps it takes longer for GC to cleanup periodically.  I'm probably going to have to watch this over a couple of days to see if the data follows this behavior.
            treybohon Trey Bohon added a comment -

            So a full GC run, eg:
            jcmd.exe %pid% GC.run


            Only seems to recover a small amount of execution time, which reflects what Anand implied with at least 2 major leaks with the 2nd being fixed now.  Something independent of the GC also seems to recover execution time periodically, but it never recovers completely and trends upward. I'm just going to work around this with weekly restarts that coincide with our IT maintenance window.


            In case it's useful - our production server leaks even with just calling Job DSL whereas my dev machine does not.  Major differences are:

            Production (leaks):

            JDK 1.8.0_131 x64
            <arguments>server -XX:+AlwaysPreTouch -Xloggc:$JENKINS_HOME/gc%t.log -XX:NumberOfGCLogFiles=5 -XX:+UseGCLogFileRotation -XX:GCLogFileSize=20m -XX:+PrintGC -XX:+PrintGCDateStamps -XX:+PrintGCDetails -XX:+PrintHeapAtGC -XX:+PrintGCCause -XX:+PrintTenuringDistribution -XX:+PrintReferenceGC -XX:+PrintAdaptiveSizePolicy -XX:+UseG1GC -XX:+ExplicitGCInvokesConcurrent -XX:+ParallelRefProcEnabled -XX:+UseStringDeduplication -XX:+UnlockExperimentalVMOptions -XX:G1NewSizePercent=20 -XX:+UnlockDiagnosticVMOptions -XX:G1SummarizeRSetStatsPeriod=1 -XX:InitiatingHeapOccupancyPercent=70 -Xrs -Xms100g -Xmx100g -Dhudson.lifecycle=hudson.lifecycle.WindowsServiceLifecycle -jar "%BASE%\jenkins.war" --httpPort=8080 --webroot="%BASE%\war"</arguments>


            Dev (does not):
            JDK 1.8.0_112 x64

            <arguments>-XX:InitiatingHeapOccupancyPercent=70 -Xrs -Xms4g -Xmx4g -Dhudson.lifecycle=hudson.lifecycle.WindowsServiceLifecycle -jar "%BASE%\jenkins.war" --httpPort=9090 --webroot="%BASE%\war"</arguments>


            treybohon Trey Bohon added a comment - So a full GC run, eg: jcmd.exe %pid% GC.run   Only seems to recover a small amount of execution time, which reflects what Anand implied with at least 2 major leaks with the 2nd being fixed now.  Something independent of the GC also seems to recover execution time periodically, but it never recovers completely and trends upward. I'm just going to work around this with weekly restarts that coincide with our IT maintenance window.   In case it's useful - our production server leaks even with just calling Job DSL whereas my dev machine does not.  Major differences are: Production (leaks): JDK 1.8.0_131 x64 <arguments> server -XX:+AlwaysPreTouch -Xloggc:$JENKINS_HOME/gc %t.log -XX:NumberOfGCLogFiles=5 -XX:+UseGCLogFileRotation -XX:GCLogFileSize=20m -XX:+PrintGC -XX:+PrintGCDateStamps -XX:+PrintGCDetails -XX:+PrintHeapAtGC -XX:+PrintGCCause -XX:+PrintTenuringDistribution -XX:+PrintReferenceGC -XX:+PrintAdaptiveSizePolicy -XX:+UseG1GC -XX:+ExplicitGCInvokesConcurrent -XX:+ParallelRefProcEnabled -XX:+UseStringDeduplication -XX:+UnlockExperimentalVMOptions -XX:G1NewSizePercent=20 -XX:+UnlockDiagnosticVMOptions -XX:G1SummarizeRSetStatsPeriod=1 -XX:InitiatingHeapOccupancyPercent=70 -Xrs -Xms100g -Xmx100g -Dhudson.lifecycle=hudson.lifecycle.WindowsServiceLifecycle -jar "%BASE%\jenkins.war" --httpPort=8080 --webroot="%BASE%\war"</arguments>   Dev (does not): JDK 1.8.0_112 x64 <arguments>-XX:InitiatingHeapOccupancyPercent=70 -Xrs -Xms4g -Xmx4g -Dhudson.lifecycle=hudson.lifecycle.WindowsServiceLifecycle -jar "%BASE%\jenkins.war" --httpPort=9090 --webroot="%BASE%\war"</arguments>  
            ajmsh Anand Shah added a comment -

            Jenkins version: 2.32.2

            Just an update: After setting "-Dgroovy.use.classvalue=true" , Jenkins master is running healthy for a week without any increased time under DSL jobs.

            Build Time Trend:


            ajmsh Anand Shah added a comment - Jenkins version: 2.32.2 Just an update: After setting " -Dgroovy.use.classvalue=true"  , Jenkins master is running healthy for a week without any increased time under DSL jobs. Build Time Trend:    

            Is there still a problem when using newer versions of Jenkins and Job DSL? If not, I'm going to close this ticket.

            daspilker Daniel Spilker added a comment - Is there still a problem when using newer versions of Jenkins and Job DSL? If not, I'm going to close this ticket.

            People

              jamietanna Jamie Tanna
              leedega Kevin Phillips
              Votes:
              8 Vote for this issue
              Watchers:
              14 Start watching this issue

              Dates

                Created:
                Updated: