-
Bug
-
Resolution: Unresolved
-
 Major
Major
-
None
-
Jenkins version: 2.190.3
Plugins:
ace-editor 1.1
ansicolor 0.6.2
ant 1.10
antisamy-markup-formatter 1.6
apache-httpcomponents-client-4-api 4.5.10-2.0
artifactory 3.4.1
authentication-tokens 1.3
authorize-project 1.3.0
bouncycastle-api 2.17
branch-api 2.5.5
build-failure-analyzer 1.24.0 false
build-flow-plugin 0.20
build-keeper-plugin 1.3
build-monitor-plugin 1.12+build.201809061734
build-name-setter 2.0.3
build-pipeline-plugin 1.5.8
build-timeout 1.19
build-timestamp 1.0.3
cloud-stats 0.25
cloudbees-disk-usage-simple 0.9
cloudbees-folder 6.10.0
command-launcher 1.4
conditional-buildstep 1.3.6
config-file-provider 3.6.2
credentials 2.3.0
credentials-binding 1.20
description-setter 1.10
display-url-api 2.3.2
docker-commons 1.15
docker-java-api 3.0.14
docker-plugin 1.1.9
docker-workflow 1.21
durable-task 1.33
envinject 2.3.0
envinject-api 1.7
external-monitor-job 1.7
ghprb 1.42.0
git 4.0.0
git-client 3.0.0
git-server 1.9
github 1.29.5
github-api 1.95
gradle 1.35
groovy 2.2
groovy-label-assignment 1.2.0
handlebars 1.1.1
icon-shim 2.0.3
ivy 2.1
jackson2-api 2.10.1
javadoc 1.5
jdk-tool 1.4
job-import-plugin 3.3
jobConfigHistory 2.24
jquery 1.12.4-1
jquery-detached 1.2.1
jquery-ui 1.0.2
jsch 0.1.55.1
junit 1.28
label-linked-jobs 5.1.2
ldap 1.21
lockable-resources 2.7
log-parser 2.1
mailer 1.29
mapdb-api 1.0.9.0
matrix-auth 2.5
matrix-project 1.14
maven-plugin 3.4
metrics 4.0.2.6
momentjs 1.1.1
multiple-scms 0.6
next-build-number 1.6
openstack-cloud 2.51-SNAPSHOT (private-658def72-peter)
pam-auth 1.6
Parameterized-Remote-Trigger 3.1.0
parameterized-trigger 2.36
pegdown-formatter 1.3
pipeline-build-step 2.10
pipeline-graph-analysis 1.10
pipeline-input-step 2.11
pipeline-milestone-step 1.3.1
pipeline-model-api 1.5.0
pipeline-model-declarative-agent 1.1.1
pipeline-model-definition 1.5.0
pipeline-model-extensions 1.5.0
pipeline-rest-api 2.12
pipeline-stage-step 2.3
pipeline-stage-tags-metadata 1.5.0
pipeline-stage-view 2.12
pipeline-utility-steps 2.3.1
plain-credentials 1.5
postbuild-task 1.8
powershell 1.4
publish-over 0.22
publish-over-ssh 1.20.1
purge-build-queue-plugin 1.0
rebuild 1.31
resource-disposer 0.14
role-strategy 2.15
run-condition 1.2
saferestart 0.3
saml 1.1.4
scm-api 2.6.3
script-security 1.68
sidebar-link 1.11.0
simple-theme-plugin 0.5.1
slack 2.34
ssh-agent 1.17
ssh-credentials 1.18
ssh-slaves 1.31.0
structs 1.20
subversion 2.12.2
teamconcert 1.1.9.5-SNAPSHOT (private-7318df45-jenkins)
teamconcert-git 2.0.0
test-results-analyzer 0.3.5
timestamper 1.10
token-macro 2.10
trilead-api 1.0.5
variant 1.3
windows-slaves 1.5
workflow-aggregator 2.6
workflow-api 2.38
workflow-basic-steps 2.18
workflow-cps 2.78
workflow-cps-global-lib 2.15
workflow-durable-task-step 2.35
workflow-job 2.36
workflow-multibranch 2.21
workflow-scm-step 2.9
workflow-step-api 2.21
workflow-support 3.3
ws-cleanup 0.37
* Note: The custom OpenStack plugin is just v2.51 with https://github.com/jenkinsci/openstack-cloud-plugin/pull/278 applied. The problem described in this bug report was also witnessed with a non-custom version, so it's not specific to the custom version.Jenkins version: 2.190.3 Plugins: ace-editor 1.1 ansicolor 0.6.2 ant 1.10 antisamy-markup-formatter 1.6 apache-httpcomponents-client-4-api 4.5.10-2.0 artifactory 3.4.1 authentication-tokens 1.3 authorize-project 1.3.0 bouncycastle-api 2.17 branch-api 2.5.5 build-failure-analyzer 1.24.0 false build-flow-plugin 0.20 build-keeper-plugin 1.3 build-monitor-plugin 1.12+build.201809061734 build-name-setter 2.0.3 build-pipeline-plugin 1.5.8 build-timeout 1.19 build-timestamp 1.0.3 cloud-stats 0.25 cloudbees-disk-usage-simple 0.9 cloudbees-folder 6.10.0 command-launcher 1.4 conditional-buildstep 1.3.6 config-file-provider 3.6.2 credentials 2.3.0 credentials-binding 1.20 description-setter 1.10 display-url-api 2.3.2 docker-commons 1.15 docker-java-api 3.0.14 docker-plugin 1.1.9 docker-workflow 1.21 durable-task 1.33 envinject 2.3.0 envinject-api 1.7 external-monitor-job 1.7 ghprb 1.42.0 git 4.0.0 git-client 3.0.0 git-server 1.9 github 1.29.5 github-api 1.95 gradle 1.35 groovy 2.2 groovy-label-assignment 1.2.0 handlebars 1.1.1 icon-shim 2.0.3 ivy 2.1 jackson2-api 2.10.1 javadoc 1.5 jdk-tool 1.4 job-import-plugin 3.3 jobConfigHistory 2.24 jquery 1.12.4-1 jquery-detached 1.2.1 jquery-ui 1.0.2 jsch 0.1.55.1 junit 1.28 label-linked-jobs 5.1.2 ldap 1.21 lockable-resources 2.7 log-parser 2.1 mailer 1.29 mapdb-api 1.0.9.0 matrix-auth 2.5 matrix-project 1.14 maven-plugin 3.4 metrics 4.0.2.6 momentjs 1.1.1 multiple-scms 0.6 next-build-number 1.6 openstack-cloud 2.51-SNAPSHOT (private-658def72-peter) pam-auth 1.6 Parameterized-Remote-Trigger 3.1.0 parameterized-trigger 2.36 pegdown-formatter 1.3 pipeline-build-step 2.10 pipeline-graph-analysis 1.10 pipeline-input-step 2.11 pipeline-milestone-step 1.3.1 pipeline-model-api 1.5.0 pipeline-model-declarative-agent 1.1.1 pipeline-model-definition 1.5.0 pipeline-model-extensions 1.5.0 pipeline-rest-api 2.12 pipeline-stage-step 2.3 pipeline-stage-tags-metadata 1.5.0 pipeline-stage-view 2.12 pipeline-utility-steps 2.3.1 plain-credentials 1.5 postbuild-task 1.8 powershell 1.4 publish-over 0.22 publish-over-ssh 1.20.1 purge-build-queue-plugin 1.0 rebuild 1.31 resource-disposer 0.14 role-strategy 2.15 run-condition 1.2 saferestart 0.3 saml 1.1.4 scm-api 2.6.3 script-security 1.68 sidebar-link 1.11.0 simple-theme-plugin 0.5.1 slack 2.34 ssh-agent 1.17 ssh-credentials 1.18 ssh-slaves 1.31.0 structs 1.20 subversion 2.12.2 teamconcert 1.1.9.5-SNAPSHOT (private-7318df45-jenkins) teamconcert-git 2.0.0 test-results-analyzer 0.3.5 timestamper 1.10 token-macro 2.10 trilead-api 1.0.5 variant 1.3 windows-slaves 1.5 workflow-aggregator 2.6 workflow-api 2.38 workflow-basic-steps 2.18 workflow-cps 2.78 workflow-cps-global-lib 2.15 workflow-durable-task-step 2.35 workflow-job 2.36 workflow-multibranch 2.21 workflow-scm-step 2.9 workflow-step-api 2.21 workflow-support 3.3 ws-cleanup 0.37 * Note: The custom OpenStack plugin is just v2.51 with https://github.com/jenkinsci/openstack-cloud-plugin/pull/278 applied. The problem described in this bug report was also witnessed with a non-custom version, so it's not specific to the custom version.
I use the OpenStack Cloud plugin to dynamically provision cloud VMs from a volume snapshot. As the OpenStack plugin relies on the Cloud Statistics plugin, that's installed too. Once in a while, the cloud I provision from is afflicted with some problem or other, causing provisioning to fail. When that happens, bizarre things start to occur on the Jenkins server.
(Symptom #1) Any declarative Pipeline jobs running on master will begin to perpetually hog up their executor, even after the job has "ended" with a green tick. This happens even with a trivial Pipeline job written with declarative syntax:
pipeline {
    agent { label 'master' }
    stages {
        stage('test') {
            steps {
                echo "foobar"
            }
        }
    }
}
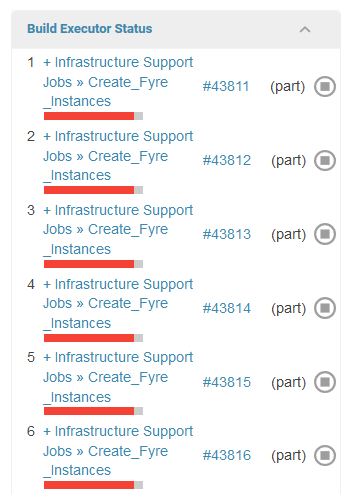
Upon closer inspection, it seems some part of Jenkins still thinks the job is running, because it shows up as such under "Build Executor Status" (see attachment: zombie-jobs.png). But the job cannot be stopped or killed. Deleting it (via /doDelete) changes the deleted job's name under "Build Executor Status" to "Unknown Pipeline node step", without however removing it from that view or freeing up the executor. The only way to free up the executor is to restart Jenkins.
This symptom has also been reported in https://issues.jenkins-ci.org/browse/JENKINS-51568.
(Symptom #2) Any non-declarative Pipeline job running on master will perpetually hang on calling the sleep() function made available by the Pipeline: Basic Steps plugin. In my case, the sleep() call is nested within a timeout() call, which doesn't time out the job under these circumstances. Thread-dumping the hung job yields:
Thread #6
	at DSL.sleep(java.util.concurrent.TimeoutException)
	at WorkflowScript.create_clusters(WorkflowScript:134)
	at WorkflowScript.run(WorkflowScript:42)
	at DSL.withCredentials(java.util.concurrent.TimeoutException)
	at WorkflowScript.run(WorkflowScript:42)
	at DSL.timestamps(java.util.concurrent.TimeoutException)
	at WorkflowScript.run(WorkflowScript:42)
	at DSL.timeout(java.util.concurrent.TimeoutException)
	at WorkflowScript.run(WorkflowScript:42)
After taking a cue from one of the comments in https://issues.jenkins-ci.org/browse/JENKINS-51568, I noticed that when these symptoms occur, all 10 jenkins.util.Timer threads on my Jenkins server's thread dump page are permanently in a "RUNNABLE" state and display:
	Number of locked synchronizers = 1
	- java.util.concurrent.ThreadPoolExecutor$Worker@6794c8b7
The stack trace for each thread makes reference to the Cloud Statistics plugin:
	at org.jenkinsci.plugins.cloudstats.CloudStatistics.save(CloudStatistics.java:272)
	at org.jenkinsci.plugins.cloudstats.CloudStatistics.persist(CloudStatistics.java:277)
	at org.jenkinsci.plugins.cloudstats.CloudStatistics.attach(CloudStatistics.java:266)
	at org.jenkinsci.plugins.cloudstats.CloudStatistics$ProvisioningListener.onFailure(CloudStatistics.java:477)
	at org.jenkinsci.plugins.cloudstats.CloudStatistics$ProvisioningListener.lambda$onFailure$1(CloudStatistics.java:464)
	at org.jenkinsci.plugins.cloudstats.CloudStatistics$ProvisioningListener$$Lambda$407/181161531.run(Unknown Source)
When Jenkins is healthy, the threads are usually in a "WAITING" state and their stack traces don't make reference to any plugins. This makes me suspect the Cloud Statistics plugin is keeping the threads busy and preventing other parts of Jenkins that rely on them from operating normally.
I most recently saw symptom #2 at around 06:45, 18 December, 2019 UTC. The last successful 2.5 minute sleep() in a non-declarative Pipeline job before that was at 06:11:59 on the same day. The attached org.jenkinsci.plugins.cloudstats.CloudStatistics.zip archive contains my $JENKINS_HOME/org.jenkinsci.plugins.cloudstats.CloudStatistics.xml from earlier today, when symptom #2 was being witnessed.**