-
Improvement
-
Resolution: Done
-
 Minor
Minor
-
None
-
Jenkins 2.303.1 on Debian Buster. InfluxDB 1.8.9
-
-
3.4
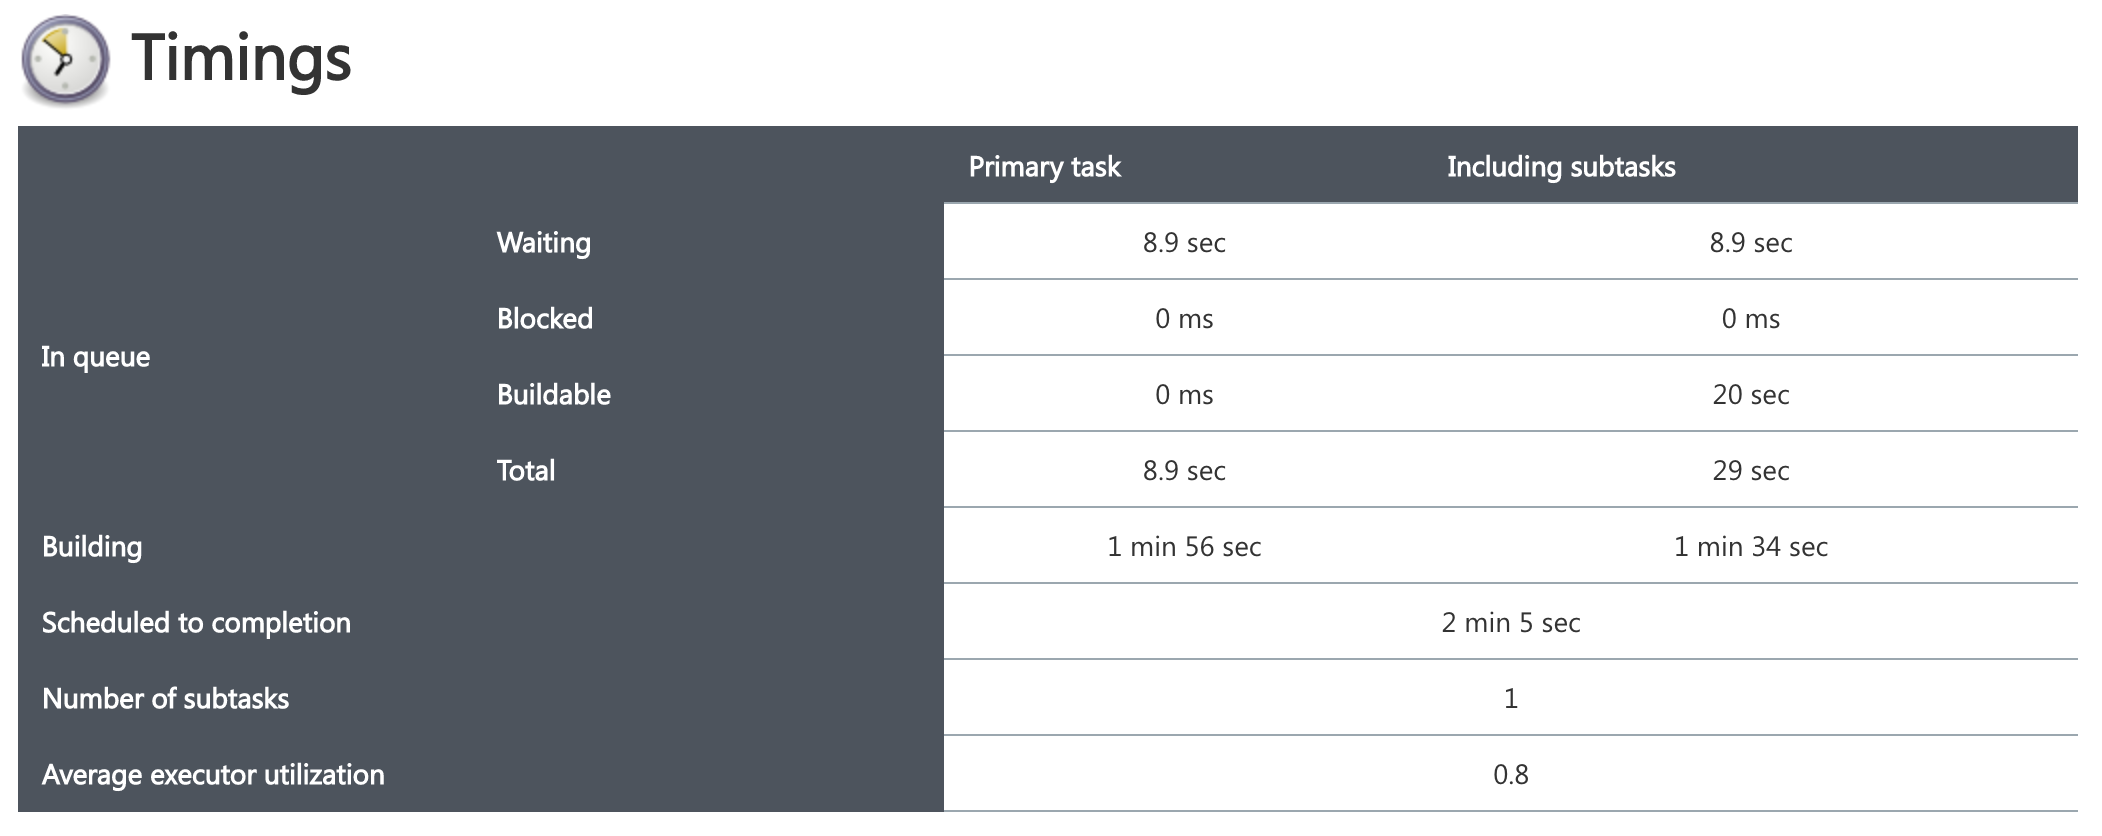
Recently set up the InfluxDB plugin for our Jenkins controller with global listener on. Trying to monitor for excessive time waiting in queue because we are deploying VM agents and also to check for starvation.
Noticed the time_in_queue values are all very small, < 10 s, even when VMs are being launched. If you look at the build page, it says "29 sec waiting." If you look at the "timings" page (attached), it says 8.9s waiting, 0s blocked, 20s buildable, for a total of 29s. time_in_queue value is 8954. Not sure if this is related to multibranch pipelines we are using, but the job waited 29 seconds before starting and I would expect the metric to reflect that.