-
Bug
-
Resolution: Fixed
-
 Critical
-
None
Setup:
Jenkins core 2.332.1 (upgrade from 2.303.2)
Kubernetes plugin: 3568.vde94f6b_41b_c8 (upgrade from 1.29.4)
Java 11 on both jenkins server and agents
agent using remoting 4.10
Websocket for the agent connection in k8s plugin
I know this is probably hard to troubleshoot but I want to open this ticket to track and see if others are experiencing the same issue. We had to end up reverting to the previous version + plugins because this was not working and I wanted to document we had to revert the LTS release.
I have also tried updating to non-lts 2.340 and the same issue was present.
Behavior:
We have a LOT of jobs that start at the same time (400+) and usually get assigned to a k8s pod. After the upgrade, jenkins would still provision agents (300+) and I confirmed the pods were starting clean, and the agent logs would show them as being CONNECTED.
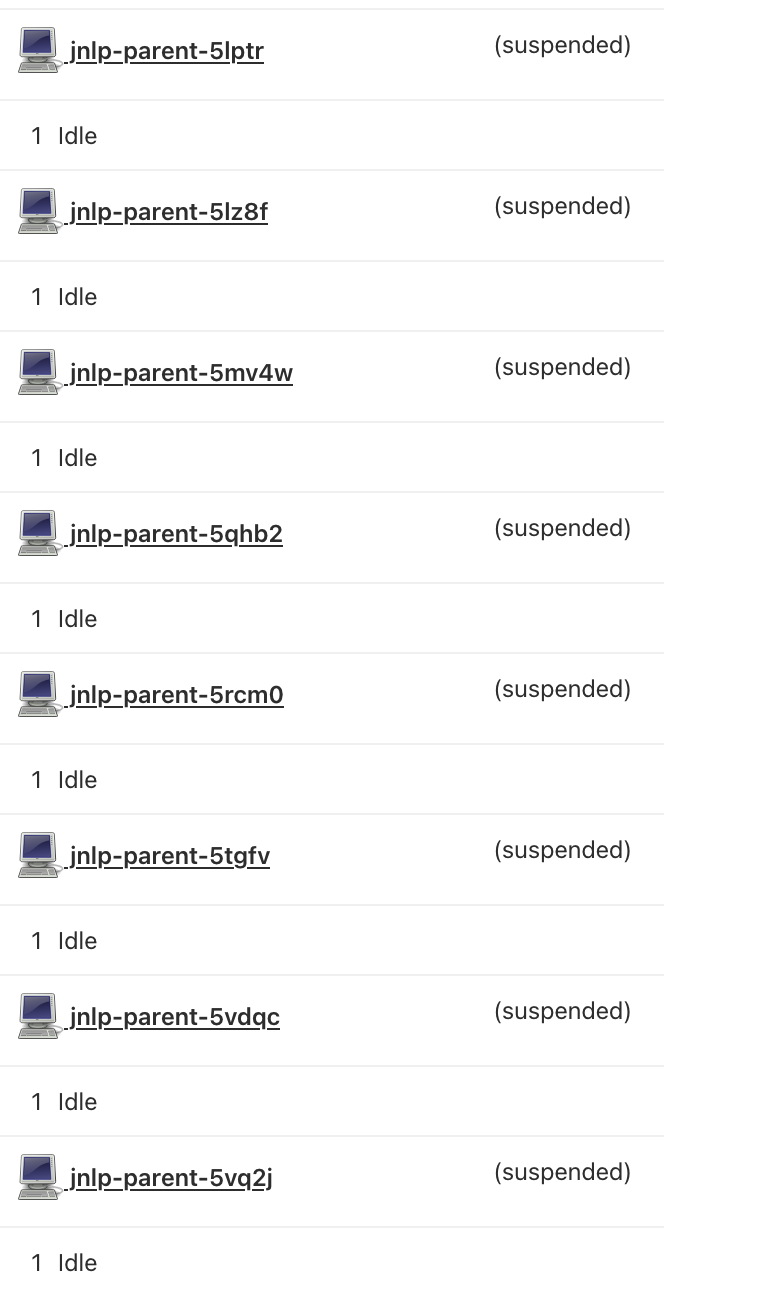
But from a jenkins perspective maybe 10-15 of them would actually be running, while the rest would show as node with an idle executor and the node as (suspended) about 300+ of them. It could stay in that state for 20 minutes+ and never actually run any of the queued jobs.

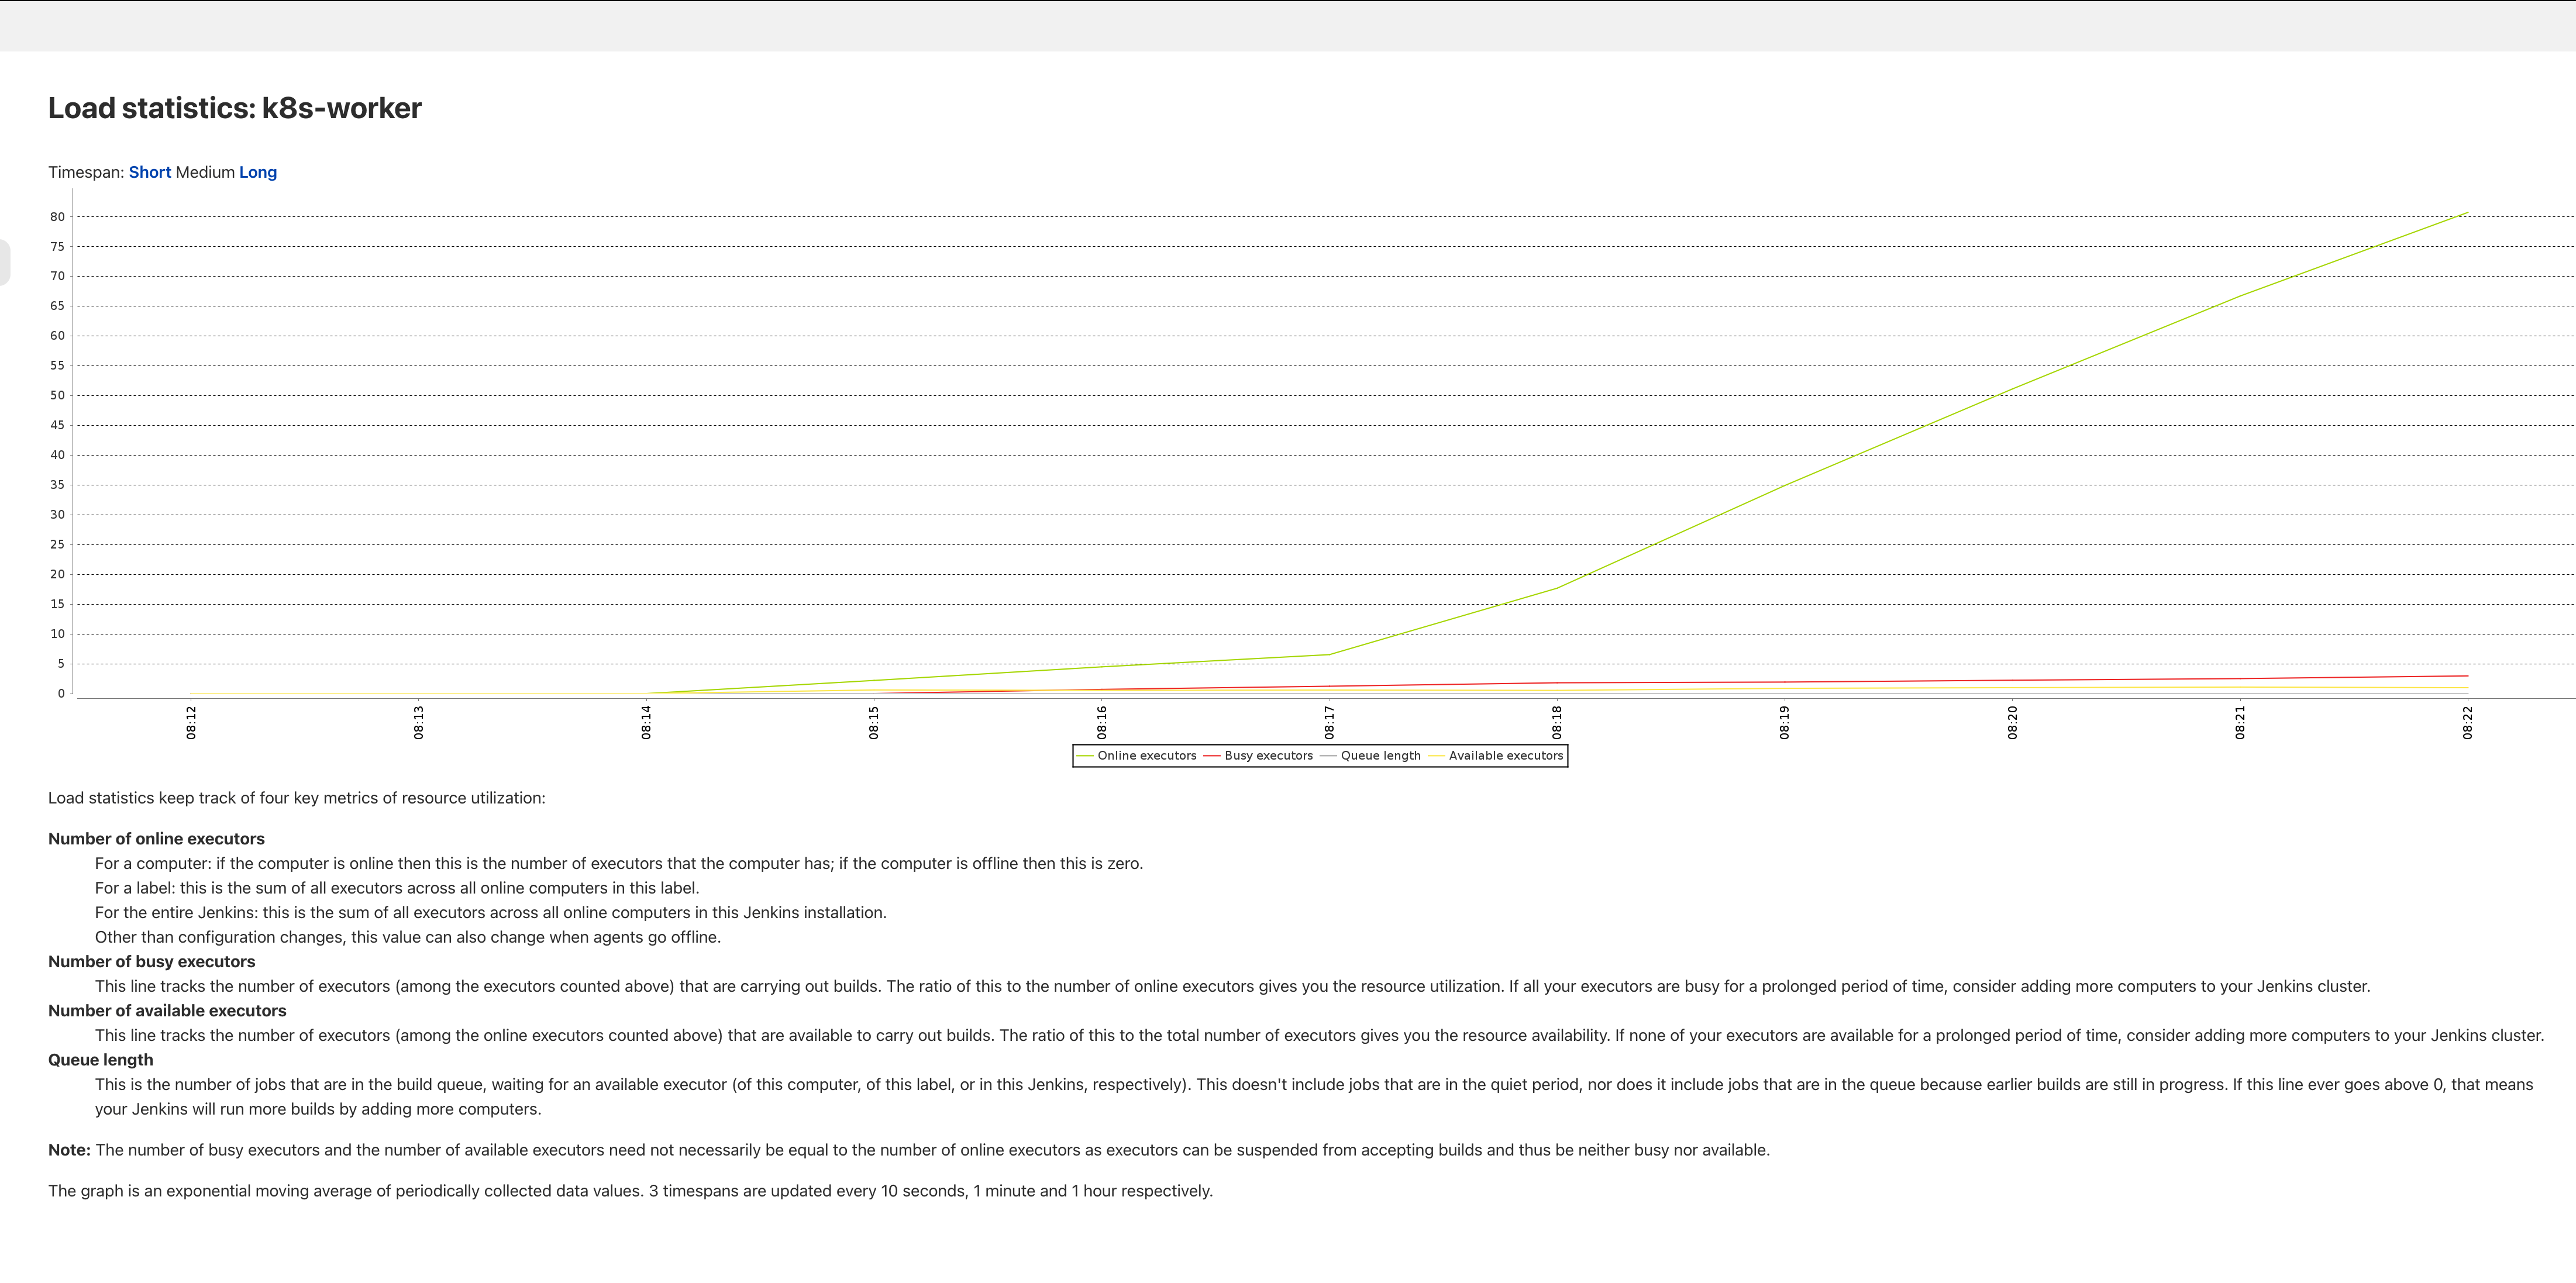
Adding a couple screenshots with the nodes showing as suspended and the ramp-up of one of the labels (you can see 80+ online executors but virtually none are running things after 6-8 minutes)
Process space:
/etc/alternatives/java -Dcom.sun.akuma.Daemon=daemonized -Xms19853m -Xmx60161m -Dhudson.model.ParametersAction.keepUndefinedParameters=true -Djava.awt.headless=true -XX:+UseG1GC -Dhudson.slaves.ChannelPinger.pingIntervalSeconds=30 -Djenkins.model.Nodes.enforceNameRestrictions=false -Djenkins.security.ApiTokenProperty.adminCanGenerateNewTokens=true -Xlog:gc:/var/lib/jenkins/log/jenkins-gc.log::filecount=5,filesize=20M -XX:+AlwaysPreTouch -XX:+ExplicitGCInvokesConcurrent -XX:+DisableExplicitGC -XX:+ParallelRefProcEnabled -XX:+UseStringDeduplication -XX:+UnlockExperimentalVMOptions -XX:G1NewSizePercent=20 -XX:+UnlockDiagnosticVMOptions -XX:G1SummarizeRSetStatsPeriod=1 -DJENKINS_HOME=/var/lib/jenkins -jar /usr/lib/jenkins/jenkins.war --logfile=/var/log/jenkins/jenkins.log --webroot=/var/cache/jenkins/war --daemon --httpPort=8080 --debug=5 --handlerCountMax=100 --handlerCountMaxIdle=20 --sessionTimeout=480 --sessionEviction=28800
Jenkins logs look ok, k8s logs (via UI logs tracking org.csanchez.jenkins.plugins.kubernetes)
Nothing to report there. The k8s logs show that we are under the limit set eg 300 out of 600 max global pods. Again the pods show up as CONNECTED but the jenkins server never actually allocate a build to the idle executor.
If you see this issue too, please comment / advise.

- links to
