-
Improvement
-
Resolution: Unresolved
-
 Minor
Minor
I'm moving dependency-check-plugin from a custom implementation of echart.js to use the echart-api-plugin.
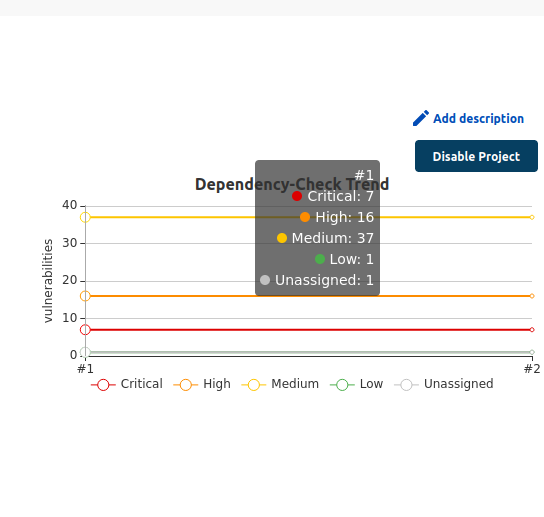
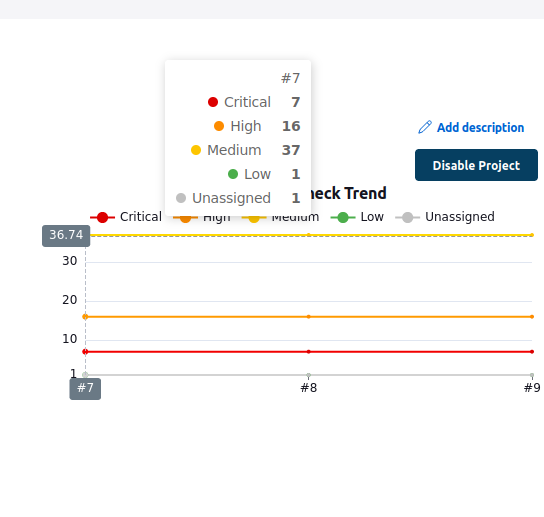
The most visible/important difference is that I can not set the label for Y Axis (rotate 90°) as you see in the picture to understand what values represent.
Original:

After porting to echart-api-plugin:
Other little differences are:
- I can not decide where line series label are placed (up or bottom)
- background of leggend