-
Bug
-
Resolution: Fixed
-
 Critical
-
None
-
linux, mac, windows
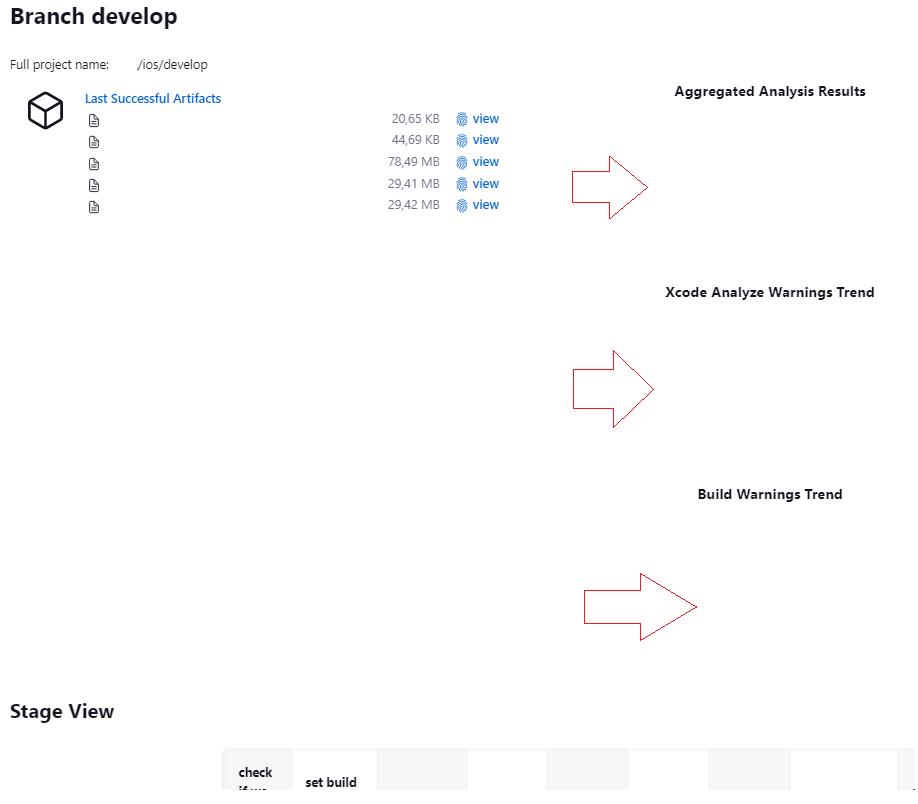
After upgrading the plugin from 9.22 to 10.1.0 all the graphs are emty. No result from recordIssues at all.
Here is the setup:
    post {
        always
        {
            recordIssues enabledForFailure: true,
                healthy: 1,
                tools: [
                    clang(id: 'scan-build', name: 'Xcode Analyze', pattern: "${PROD_IOS_DIR}/device/Iphone/PROD/build_release/scan-build.log"),
                    clang(name: 'Build')
                ],
                unhealthy: 10
        }
        success
        {
            echo 'Build succeeded'
        }
        failure
        {
            echo 'Build failed'
        }
    }
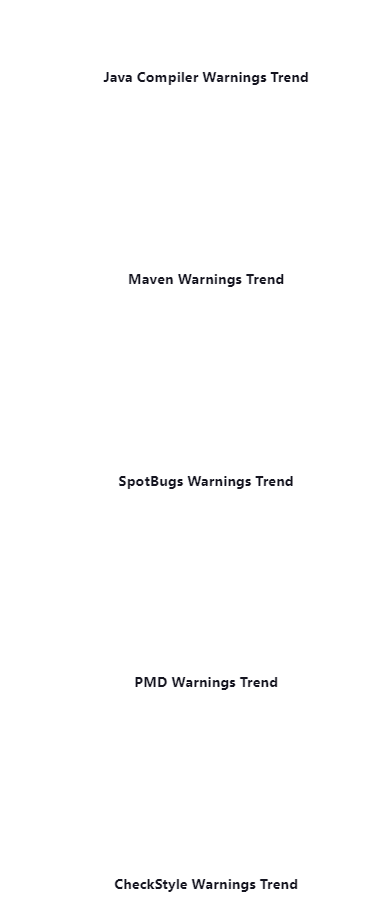
and another configuration example:
// code placeholder
  stage('Record compiler warnings and static analysis results') {
    steps {
      recordIssues(tools: [java(), mavenConsole(), spotBugs(useRankAsPriority: true), pmdParser(), cpd(), checkStyle()])
      jacoco(
        execPattern: '**/target/**.exec',
        classPattern: '**/target/classes',
        sourceInclusionPattern: '**/src/main/java/**/*.java',
      )
    }
  }
Has anyone else got this problem?}}
- duplicates
-
-
- Closed
-
