• Icon: Bug Bug
    • Resolution: Fixed
    • Icon: Major Major
    • core
    • Jenkins 2.380
      Debian bullseye
    • 2.381

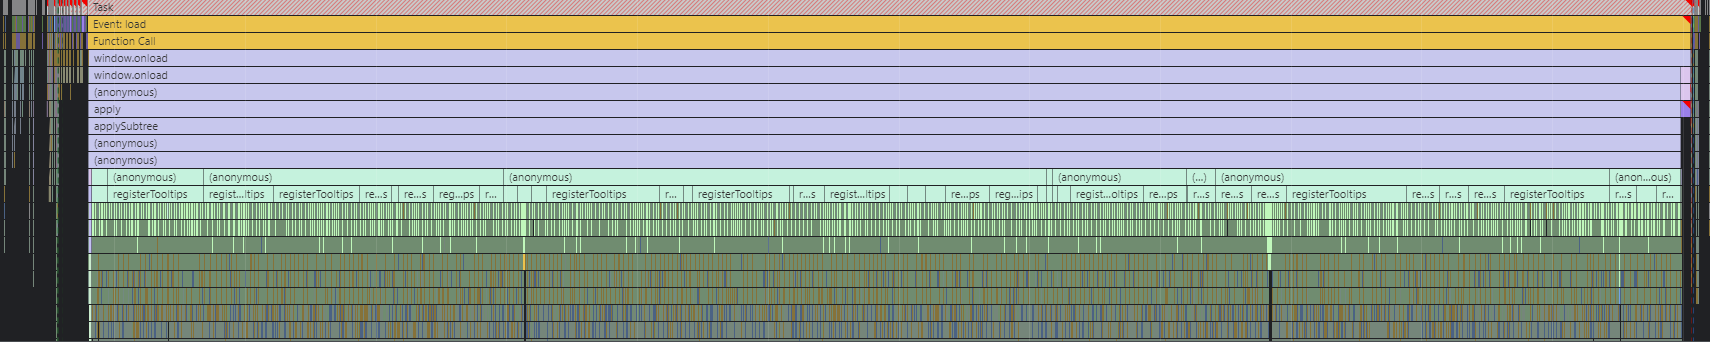
      With the latest weekly which includes the Tippy.js PR (https://github.com/jenkinsci/jenkins/pull/6408) we are seeing very long loading times on our instance (~30 seconds for the main page).
      I did a performance recording using the Chrome and Firefox dev tools and both show that calls to registerTooltips take a very long time. I am attaching a screenshot.

      I am assuming that this is related to the PR mentioned above but of course cannot be sure (especially because I am not a web/javascript developer myself).
      Please let me know if there is anything I can provide or should do to support you in solving the issue (e.g. provide some data, try things out).


          [JENKINS-70178] Very long loading times with 2.380

          Jens Beyer added a comment - - edited

          Similar issue for us, but not on the main page.

          For us, it's the job configuration page for Pipeline and Maven jobs. Every access of the configure page takes anything between 30 and 120 seconds to load.

          Maybe (can't verify though) it's our quite extensive use of the Matrix Authorization Strategy Plugin which creates tables with lots of tooltips. But at least for a few projects where we don't use that, it's much faster (but still slower than expected). I've tried to use the Chrome DevTools profiler to make a recording but it seems to be overwhelmed and doesn't show a report. I'm not a webdev either, so that would probably not be too helpful anyway.

          Edit: Uh, performance rendering came back.


          My guess: it's related to Tippy and GC.


          Edit2: Can confirm that downgrade to 2.379 fixes it.

          I'd suggest raising the severity to Critical or even Blocker, as it forces people to downgrade.

          Jens Beyer added a comment - - edited Similar issue for us, but not on the main page. For us, it's the job configuration page for Pipeline and Maven jobs. Every access of the configure page takes anything between 30 and 120 seconds to load. Maybe (can't verify though) it's our quite extensive use of the Matrix Authorization Strategy Plugin which creates tables with lots of tooltips. But at least for a few projects where we don't use that, it's much faster (but still slower than expected). I've tried to use the Chrome DevTools profiler to make a recording but it seems to be overwhelmed and doesn't show a report. I'm not a webdev either, so that would probably not be too helpful anyway. Edit: Uh, performance rendering came back.   My guess: it's related to Tippy and GC.   Edit2: Can confirm that downgrade to 2.379 fixes it. I'd suggest raising the severity to Critical or even Blocker, as it forces people to downgrade.

          Jan Faracik added a comment -

          Hey, thanks for raising and extra thanks for the performance recordings. I've opened a fix to address this issue here - https://github.com/jenkinsci/jenkins/pull/7464

          Jan Faracik added a comment - Hey, thanks for raising and extra thanks for the performance recordings. I've opened a fix to address this issue here - https://github.com/jenkinsci/jenkins/pull/7464

          M added a comment -

          FYI, you might also experience this issue at manage/role-strategy/manage-roles page

          M added a comment - FYI, you might also experience this issue at manage/role-strategy/manage-roles page

          Thanks for the quick fix janfaracik !

          I can confirm that the issue is resolved with today's weekly release (2.381) on our instance.

          Stephan Senkbeil added a comment - Thanks for the quick fix janfaracik ! I can confirm that the issue is resolved with today's weekly release (2.381) on our instance.

            janfaracik Jan Faracik
            stephansenkbeil Stephan Senkbeil
            Votes:
            1 Vote for this issue
            Watchers:
            5 Start watching this issue

              Created:
              Updated:
              Resolved: