-
Type:
Bug
-
Resolution: Fixed
-
Priority:
 Major
Major
-
Component/s: warnings-ng-plugin
-
Environment:warnings-ng 12.4.1
analysis-model-api 13.2.0
jenkins 2.492.2-lts.jdk21
After recent jenkins & plugins updates we have encountered severe performance issues on blueocean and normal job listings. These issues show as long loadtimes (more than a minute) of the branch lists and blueocean UI and occur on multibranch jobs with many branches (200+) that have issue scanning with the warnings-ng plugin enabled.
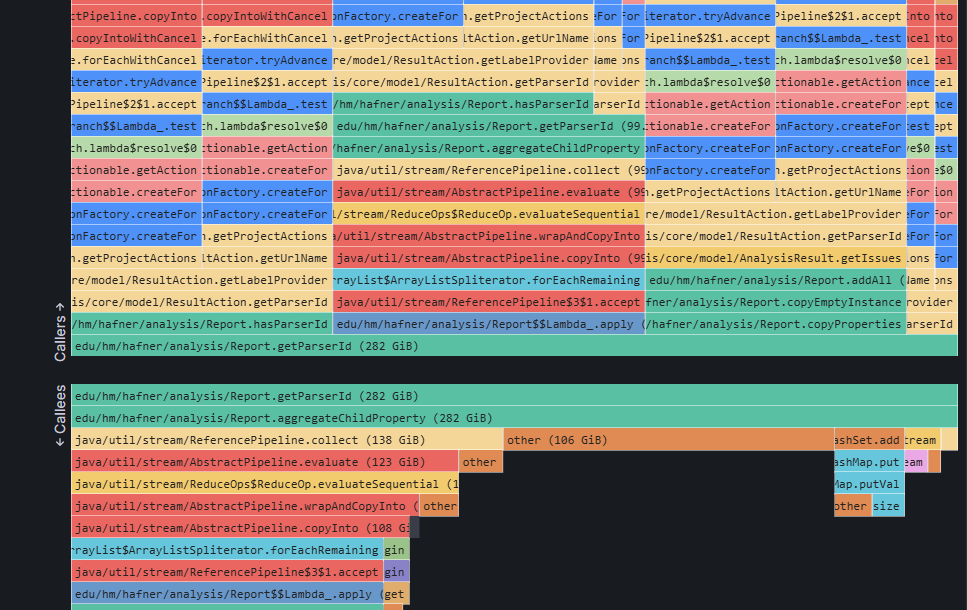
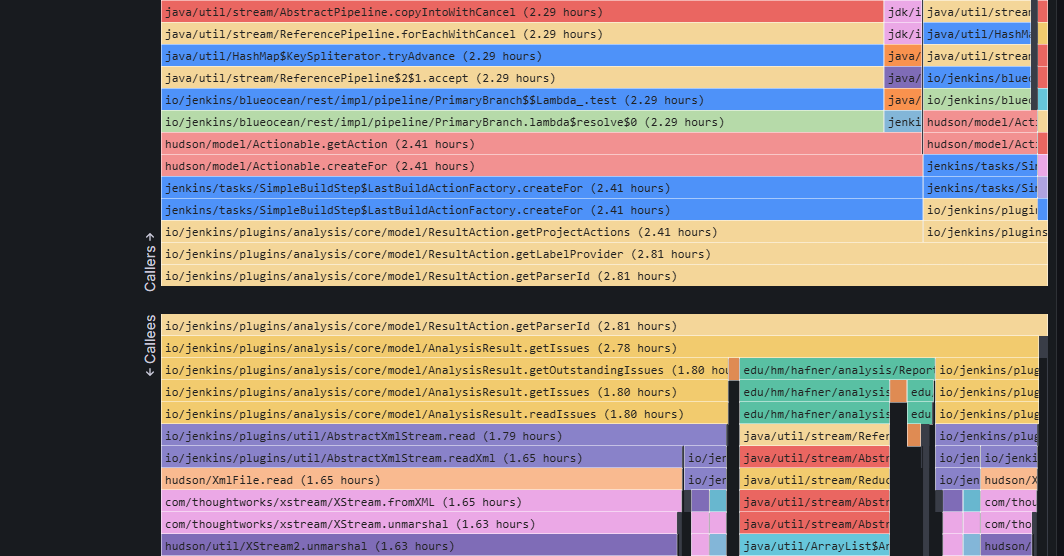
I've analyzed memory and allocation profiles of our jenkins controller and it lists getParserId as the main culprit:

This high CPU usage is also accompanied by high memory allocations and gc churn.

(note: images are not necessarily of the same time range)
I've downgraded the warnings-ng plugin to 11.12.0 and analysis-model-api to 12.9.1. This has completely resolved both the cpu usage and memory allocation issues.
- duplicates
-
JENKINS-75478 slow job list rendering when "# issues" column has high values
-

- Closed
-
- links to

