-
Type:
Bug
-
Resolution: Cannot Reproduce
-
Priority:
 Minor
Minor
-
Component/s: testng-plugin
-
None
-
Environment:testng 0.27, jenkins 1.431
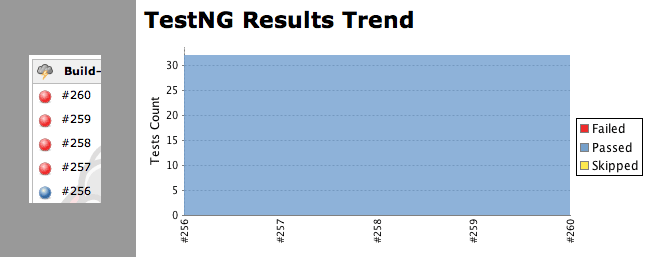
When a build fails the trend graph shows as test result the same as the last successful build though it has not run any test as the build process was interrupted prior to the tests. In the attached graphic build #256 was the last and only successful build but the trend graph makes you believe that for every build all tests passed.