-
Type:
Improvement
-
Resolution: Duplicate
-
Priority:
 Major
Major
-
Component/s: core
-
Environment:Platform: All, OS: All
Hudson can show a time graph for the overall build time, but it would be awesome
to see a graph for test execution time at arbitrary levels. For example I can
see how long it took a suite or test to run in Hudson, but I can't see a trend
of that over time.
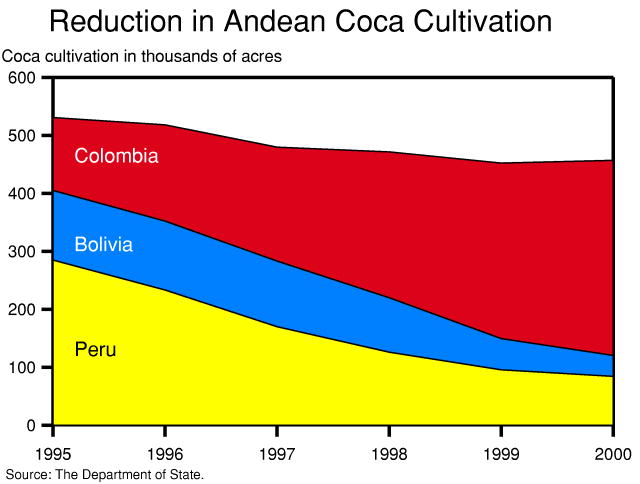
Ideally there would be a graph at any test result level, from the root package
down to individual test level, showing a stacked graph of that over time,
something like the attached image.
This way I can easily see which suites are problematic or improving in execution
time, and hopefully identify areas of my code which need performance
improvement, and identify performance regressions more easily.
There are more things that would be useful like, in the test results table, a
column which shows the % change in time which I can sort by and see which tests
have changed the most in execution time than the previous build, and also the
ability to trigger actions as a result, but those seem like separate RFEs.
- duplicates
-
-
- Reopened
-

