Uploaded image for project: 'Jenkins'
  1. Jenkins
  2. JENKINS-46350

Enabling Overall graphs

XMLWordPrintable

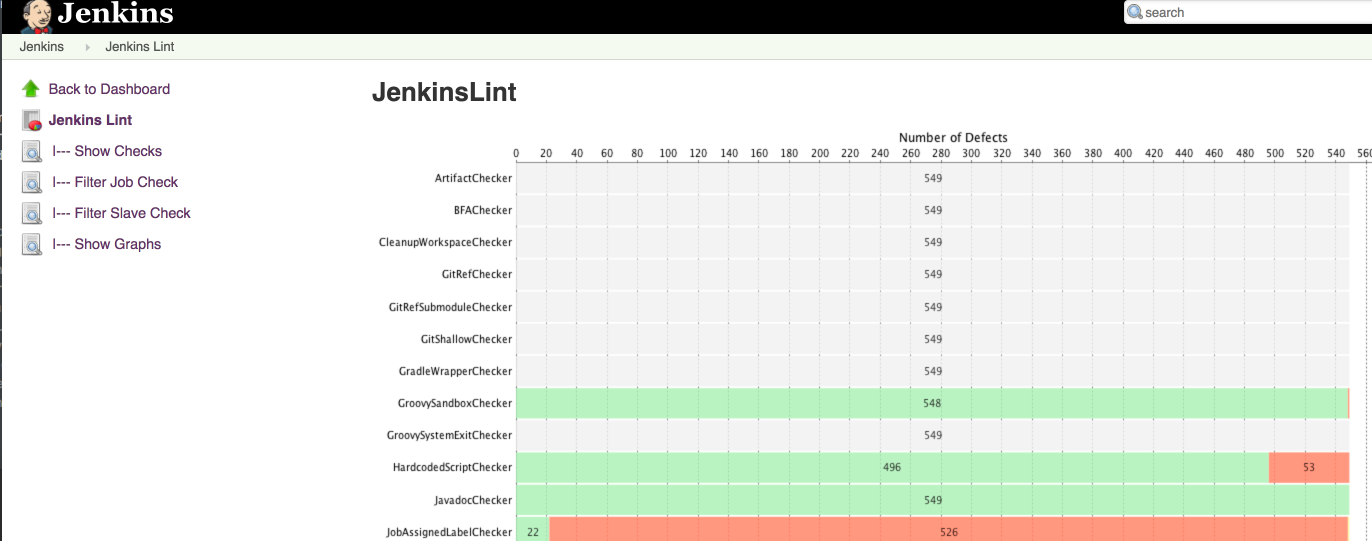
      Let's now visualise a bit better the overall view using Bars and other kind of JFreeCharts which might help to take a draft view about how the Jenkins instance looks like from the lint point of view.
       

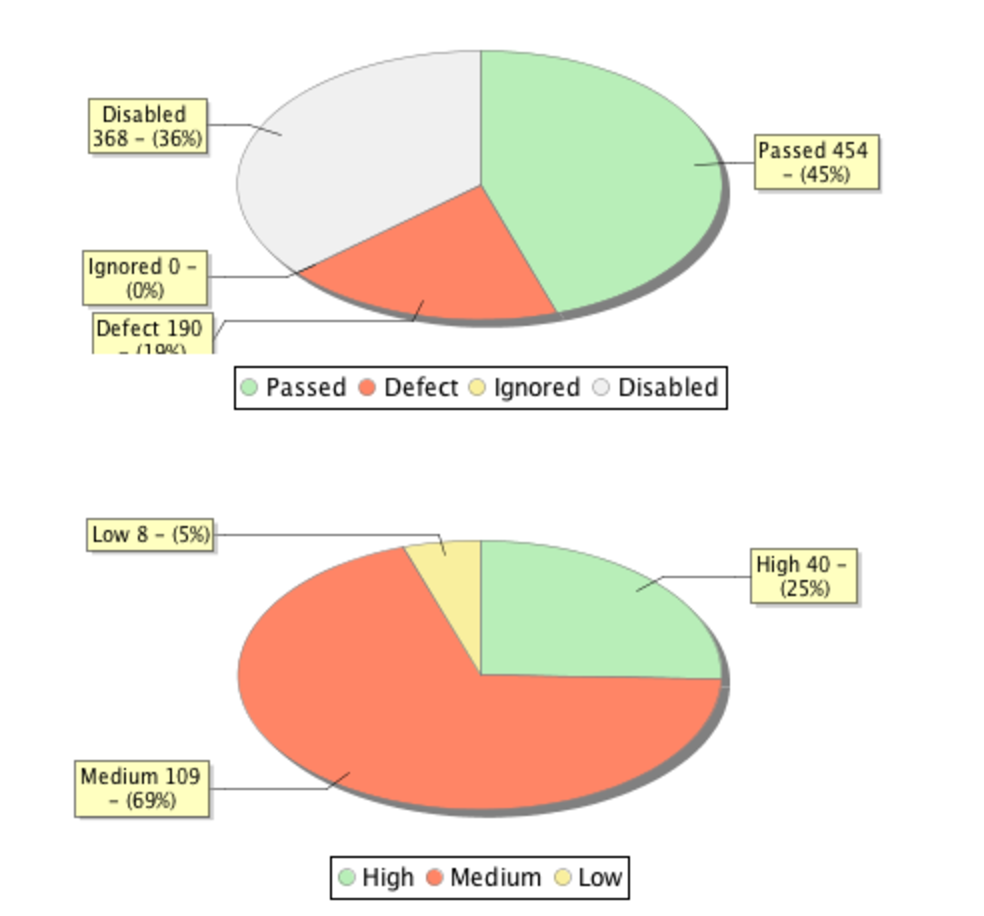
      And with something like a pie Chart to show the total number of defects per status and likely per severity:


        1. image-2017-08-22-15-53-02-509.png
          32 kB
          Victor Martinez
        2. Screen Shot 2017-08-22 at 15.48.29.png
          116 kB
          Victor Martinez
        3. Screen Shot 2017-08-22 at 16.37.16.png
          169 kB
          Victor Martinez

            v2v Victor Martinez
            v2v Victor Martinez
            Votes:
            0 Vote for this issue
            Watchers:
            2 Start watching this issue

              Created:
              Updated:
              Resolved: