-
Type:
Improvement
-
Resolution: Fixed
-
Priority:
 Minor
Minor
-
Component/s: influxdb-plugin
-
None
-
Environment:InfluxDB Plugin version: 1.13.1
Hello all together,
We have integrated sonarqube scans in our pipeline. The reporting to the sonarqube backend is done correctly.
In addition we use this plugin to write the sonarqube summary to our influxDB.
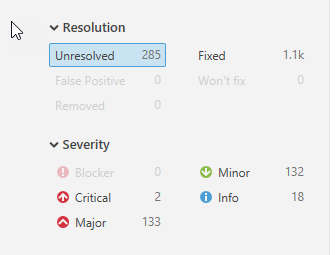
When doing this we found the following data in influxDB [1].
Correct are "time", "Build_number", "display_name", "lines_of_code", "prefix" and "project_name".
All others are far away from the numbers visible in the backend 
Any idea what might cause this issue?
Thanks for a hint
Best Regards
Frank
[1]
{"results":[{"statement_id":0,"series":[{"name":"sonarqube_data","columns":["time","blocker_issues","build_number","critical_issues","display_name","info_issues","lines_of_code","major_issues","minor_issues","prefix","project_name","project_name_1"],"values":["2018-01-04T14:22:28.379Z",14604,193,78167,"#193",115466,11555,710517,871262,"OurProjectName","OurProjectName_dev","OurProjectName_dev","2018-01-05T09:47:11.843Z",14553,198,78021,"#198",115856,5090,711544,870891,"OurProjectName","OurProjectName_dev","OurProjectName_dev","2018-01-05T09:55:49.403Z",14553,199,78021,"#199",115856,5090,711522,870796,"OurProjectName","OurProjectName_dev","OurProjectName_dev","2018-01-05T12:42:03.197Z",14553,200,78010,"#200",115762,5090,710626,870875,"OurProjectName","OurProjectName_dev","OurProjectName_dev","2018-01-05T13:11:50.377Z",14553,201,77999,"#201",115864,5090,711578,870829,"OurProjectName","OurProjectName_dev","OurProjectName_dev","2018-01-05T15:33:08.337Z",14549,203,77940,"#203",115442,5090,709856,870557,"OurProjectName","OurProjectName_dev","OurProjectName_dev","2018-01-05T16:18:58.697Z",14549,207,77934,"#207",115442,5090,709875,870687,"OurProjectName","OurProjectName_dev","OurProjectName_dev","2018-01-05T16:33:12.727Z",14549,208,77935,"#208",115442,5090,709873,870687,"OurProjectName","OurProjectName_dev","OurProjectName_dev","2018-01-06T01:50:17.431Z",14625,209,77919,"#209",115612,5090,712409,873013,"OurProjectName","OurProjectName_dev","OurProjectName_dev","2018-01-07T02:18:32.119Z",14623,210,77926,"#210",115650,5090,712456,873020,"OurProjectName","OurProjectName_dev","OurProjectName_dev","2018-01-08T01:48:07.981Z",14621,211,77937,"#211",115656,5090,712710,873169,"OurProjectName","OurProjectName_dev","OurProjectName_dev","2018-01-08T16:01:19.771Z",14581,212,77579,"#212",115746,5090,710712,869113,"OurProjectName","OurProjectName_dev","OurProjectName_dev","2018-01-09T02:22:26.056Z",14609,213,77673,"#213",115709,5090,711852,872966,"OurProjectName","OurProjectName_dev","OurProjectName_dev"]}]}]}