Uploaded image for project: 'Jenkins'
  1. Jenkins
  2. JENKINS-49225

Graph not generated on scheduled performance jobs

    • Icon: Bug Bug
    • Resolution: Unresolved
    • Icon: Major Major
    • performance-plugin
    • None
    • Jenkins v2.89.2, Performance plugin 3.4

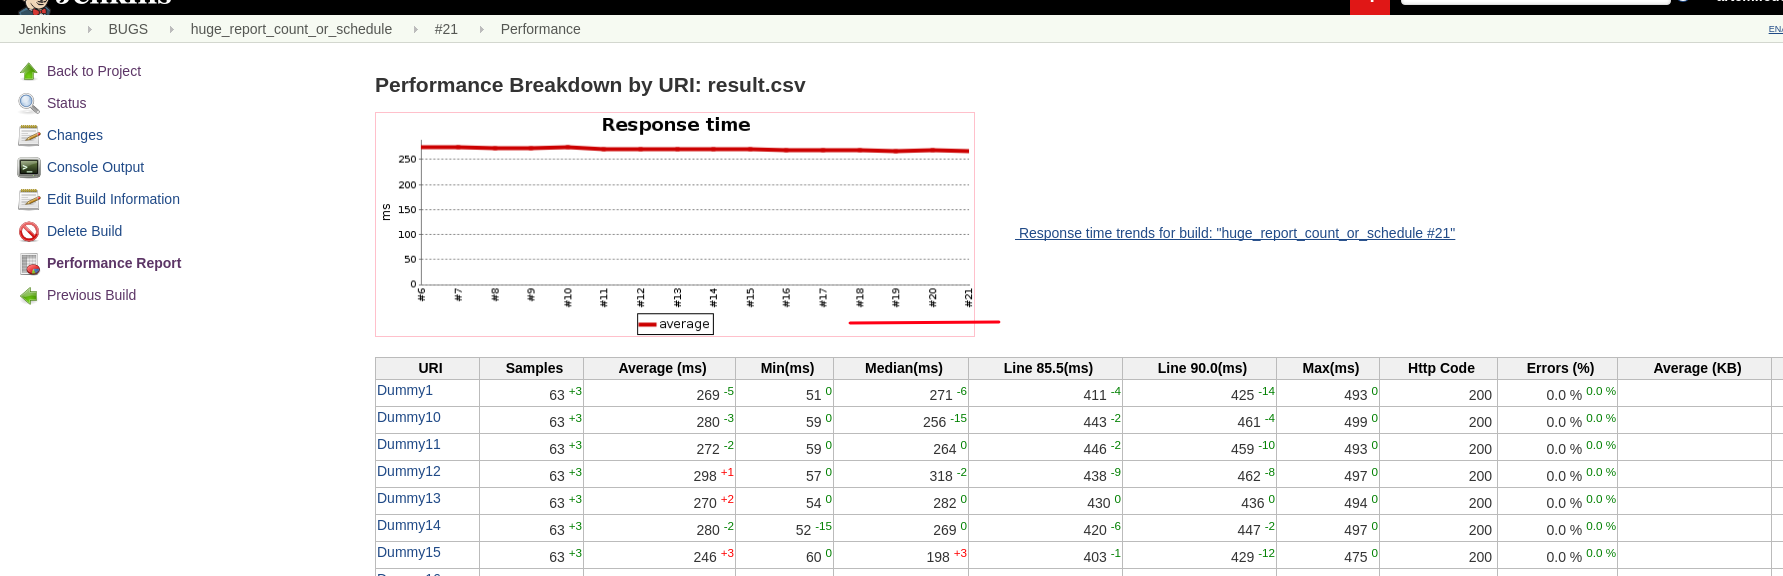
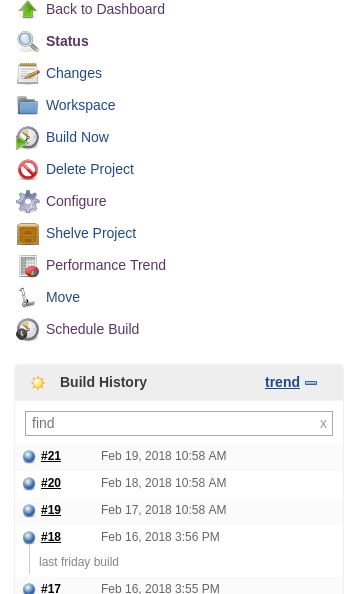
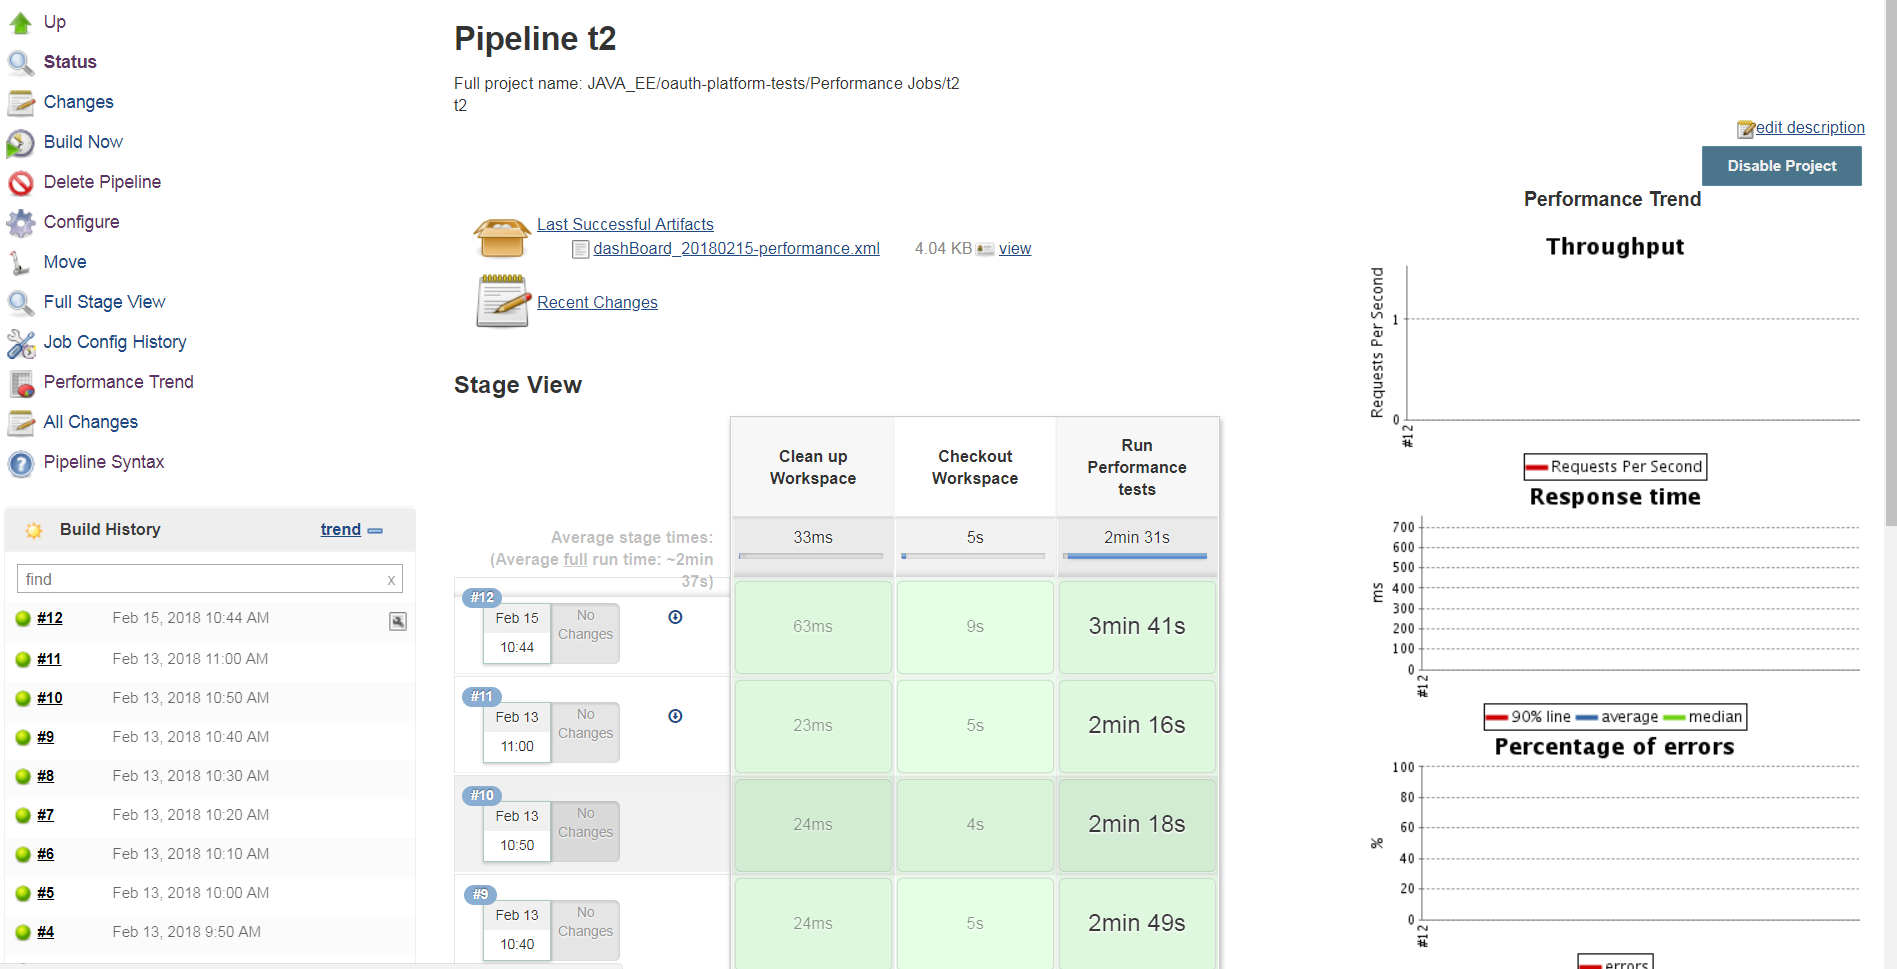
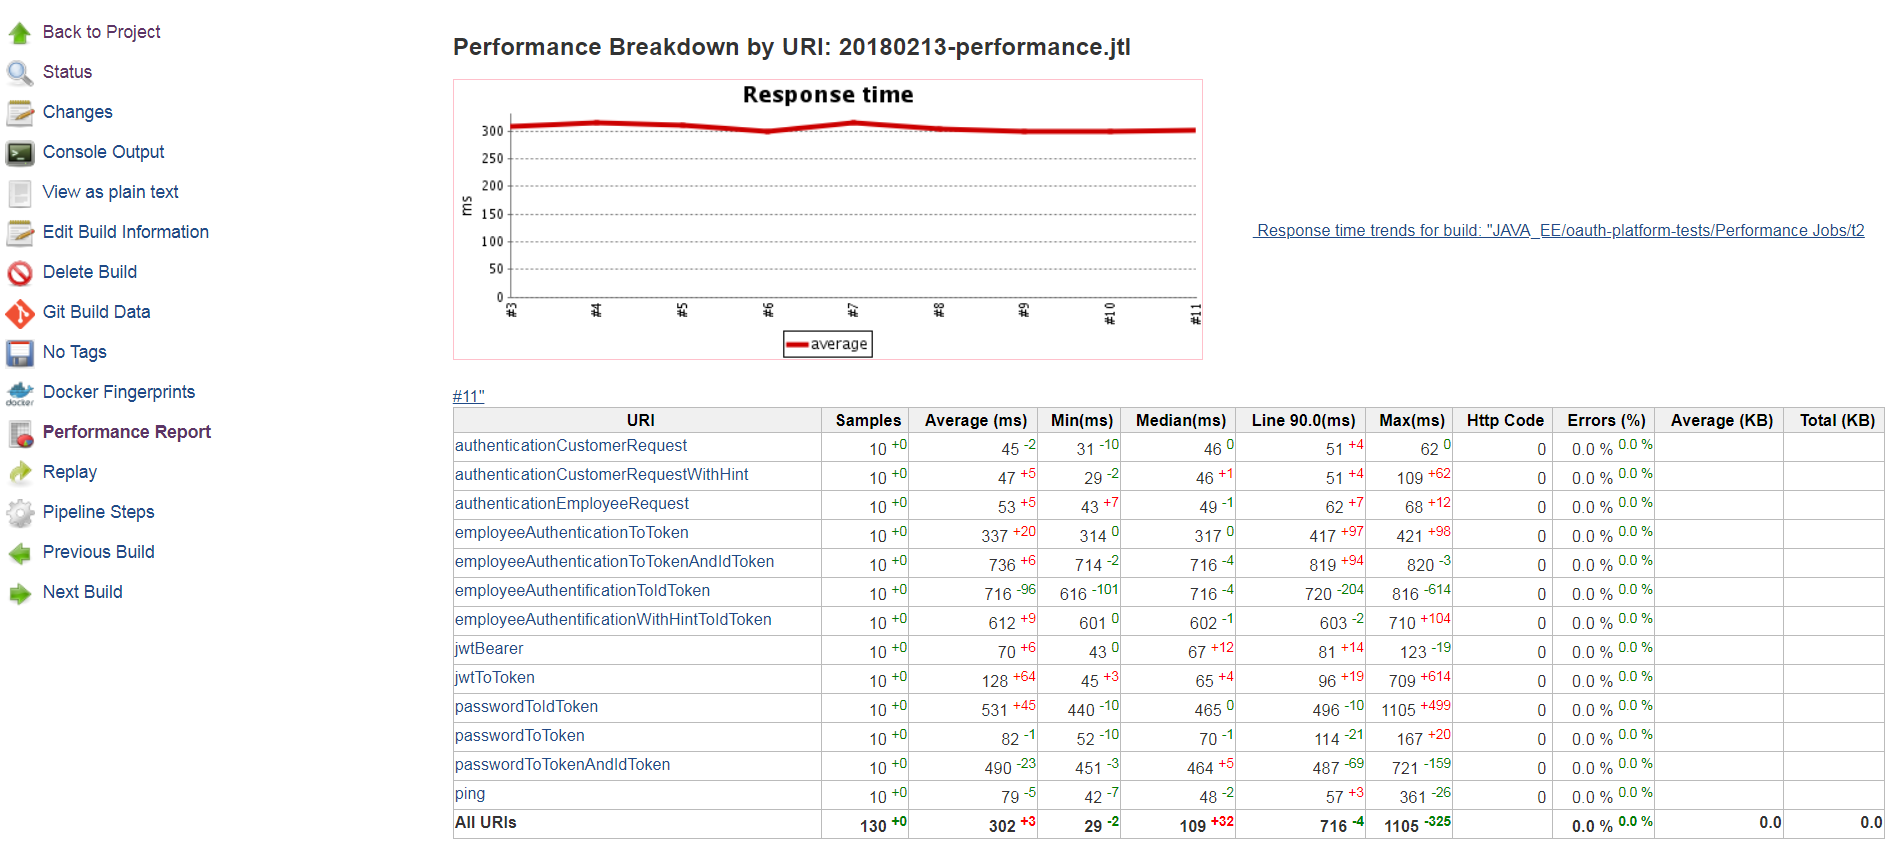
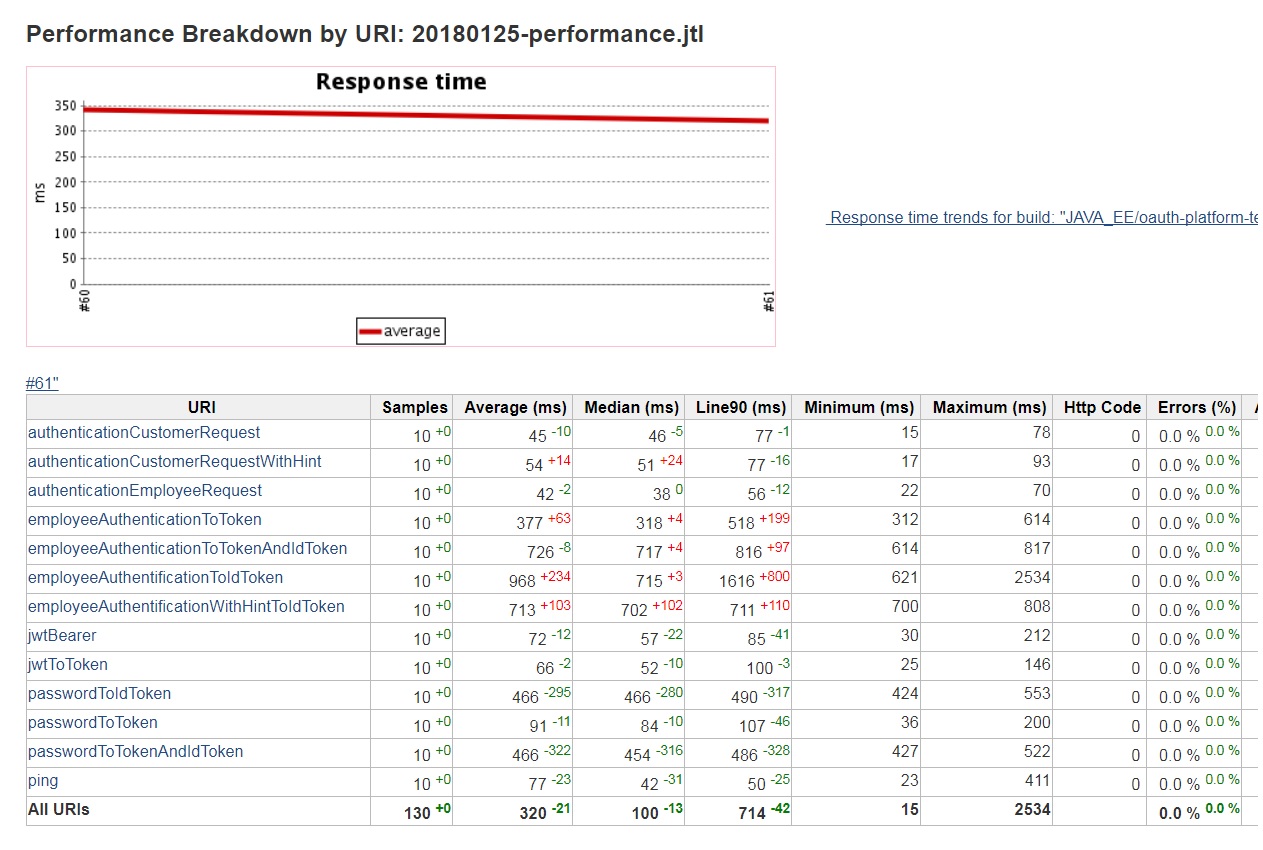
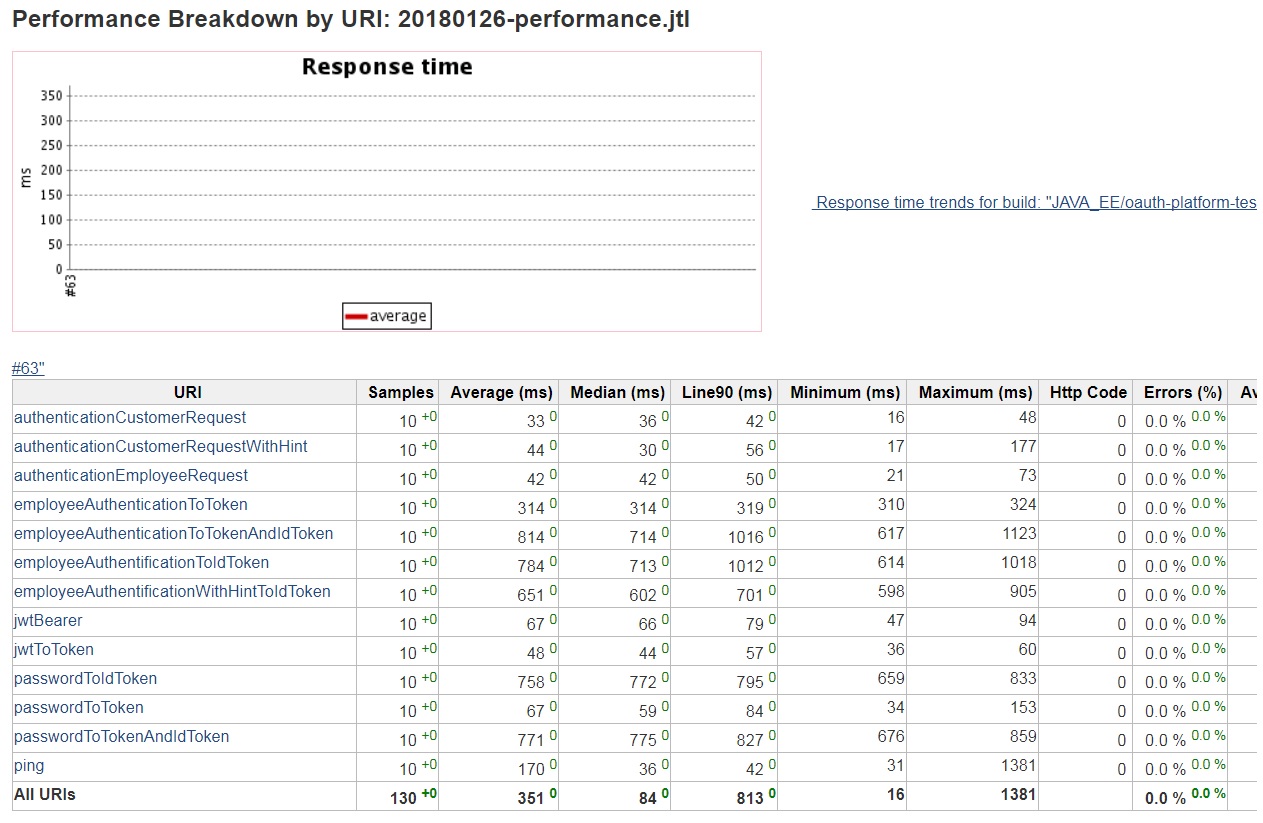
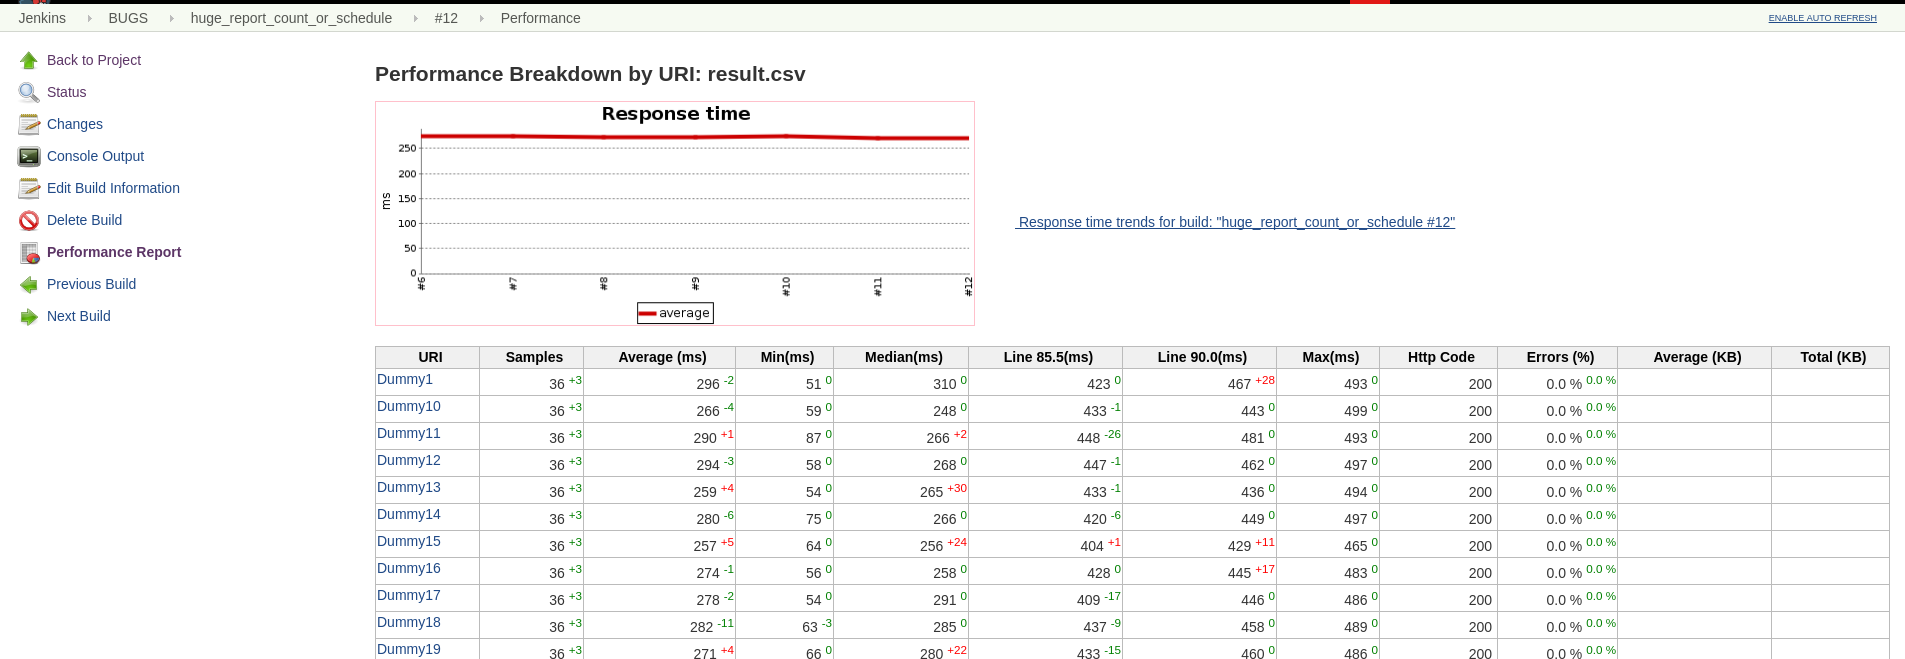
      We have a pipeline performance job running on Jenkins using JMeter. Performance job is running successfully, but graphs are not generated. No exceptions or errors in the log, just no graph generated.

      However if we start the job manually on Jenkins (on the 'Build Now') then graphs are generated.

      Attached screenshot of a scheduled and a manually triggered job, where no graph is present on the scheduled job.

        1. all_builds.png
          all_builds.png
          147 kB
        2. builds_history.png
          builds_history.png
          53 kB
        3. config.xml
          4 kB
        4. first.png
          first.png
          108 kB
        5. image-2018-02-15-11-09-15-042.png
          image-2018-02-15-11-09-15-042.png
          247 kB
        6. image-2018-02-15-11-10-53-380.png
          image-2018-02-15-11-10-53-380.png
          212 kB
        7. image-2018-02-15-11-14-13-762.png
          image-2018-02-15-11-14-13-762.png
          174 kB
        8. Performance job manually triggered.jpg
          Performance job manually triggered.jpg
          272 kB
        9. performance job scheduled.jpg
          performance job scheduled.jpg
          254 kB
        10. second.png
          second.png
          179 kB

          [JENKINS-49225] Graph not generated on scheduled performance jobs

          Artem Fedorov added a comment - - edited

          Hello,

          Which plugin do use for Schedule Build? 
          Also could you recheck that you haven't any errors messages in http://your_host/log/all

          If you refresh your page with report it doesn't  display graphs again?

          Thanks,
          Artem

          Artem Fedorov added a comment - - edited Hello, Which plugin do use for Schedule Build?  Also could you recheck that you haven't any errors messages in http://your_host/log/all If you refresh your page with report it doesn't  display graphs again? Thanks, Artem

          Hi Artem

          We schedule the job the standard way with a Build trigger marking it to build periodically based on a CRON expression.

          There is no errors in the log and no graphs when refreshing. Only if I click Build now it generates a graph.


          Kind regards

          Kasper

          Kasper Maylann added a comment - Hi Artem We schedule the job the standard way with a Build trigger marking it to build periodically based on a CRON expression. There is no errors in the log and no graphs when refreshing. Only if I click Build now it generates a graph.   Kind regards Kasper

          Artem Fedorov added a comment -

          Kasper

          I configured Build periodically with the following value "*/1 * * * *" that means build each minute and I got the following result:

          At the first build in my job history I haven't  Performance report graphs,  because plugins cannot compare the first build with nothing.

          A few minutes after I have more builds and all of them have graphs in Performance Report

          As I understand your screenshots now you executed manually Builds 60 & 61. Than you removed them and settup build periodically (build 62 and also removed build 62). And after it you open the first build (#63) that doesn't contains graphs, because it haven't builds story. Is my assumption correct?

          Could you reproduce my experiment?

          Thanks,
          Artem

          Artem Fedorov added a comment - Kasper I configured Build periodically with the following value "*/1 * * * *" that means build each minute and I got the following result: At the first build in my job history I haven't  Performance report graphs,  because plugins cannot compare the  first build with nothing. A few minutes after I have more builds and all of them have graphs in Performance Report As I understand your screenshots now you executed manually Builds 60 & 61. Than you removed them and settup build periodically (build 62 and also removed build 62). And after it you open the first build (#63) that doesn't contains graphs, because it haven't builds story. Is my assumption correct? Could you reproduce my experiment? Thanks, Artem

          Hi Artem

          So to clarify my screenshot, builds have been scheduled to run each day from build #1 to #60 where no graph was available. I then manually pushed "Build now" (build #61) and a graph was generated, though only using data from #60 and #61. After that build 62 and 63 ran as scheduled and again the graph now seems to be missing. So if I go to "Performance report" menu point on build 61 (the manually triggered build) I will see the performance graph but going to Performance graph on build 62 or 63 I just get that empty graph like if it was the first build.


          And now to run your little experiment. I set the same job to run every 10 minutes. And a first I was like wtf this is working! I now see the graph and a column for each build are added to. So I set the schedule to once a day instead (though I missed a day as you will see in screenshot), and then again the graph was missing.


          Here you see the job where build 1 to 11 was on the 10 minute schedule and then build 12 back to the daily schedule (H 10 * * *)

          There ^ you see my build history.

          When I go to the performance report for build 11 I see the performance graph.

          But going to the performance report on build 12, then no graph

          Kasper Maylann added a comment - Hi Artem So to clarify my screenshot, builds have been scheduled to run each day from build #1 to #60 where no graph was available. I then manually pushed "Build now" (build #61) and a graph was generated, though only using data from #60 and #61. After that build 62 and 63 ran as scheduled and again the graph now seems to be missing. So if I go to "Performance report" menu point on build 61 (the manually triggered build) I will see the performance graph but going to Performance graph on build 62 or 63 I just get that empty graph like if it was the first build.   And now to run your little experiment. I set the same job to run every 10 minutes. And a first I was like wtf this is working! I now see the graph and a column for each build are added to. So I set the schedule to once a day instead (though I missed a day as you will see in screenshot), and then again the graph was missing.   Here you see the job where build 1 to 11 was on the 10 minute schedule and then build 12 back to the daily schedule (H 10 * * *) There ^ you see my build history. When I go to the performance report for build 11 I see the performance graph. But going to the performance report on build 12, then no graph

          Artem Fedorov added a comment -

          I tried with config Build periodically : "H 10 * * *" 
          I got 3 build for weekend 19-21

          And when I opened it i saw graphs  

          So, I really don't understand how I can reproduce this bug.. Maybe answers for the following questions  can help me:

          1) Did You open Performance Report manually ? (Or use some automatization scripts)
          2) How you generate your report before use this post build step?
          3) Could you recheck whick plugins version you use
          4) Can you share your config of this post build step?

          Thanks, 
          Artem


          Artem Fedorov added a comment - I tried with config Build periodically : "H 10 * * *"  I got 3 build for weekend 19-21 And when I opened it i saw graphs    So, I really don't understand how I can reproduce this bug.. Maybe answers for the following questions  can help me: 1) Did You open Performance Report manually ? (Or use some automatization scripts) 2) How you generate your report before use this post build step? 3) Could you recheck whick plugins version you use 4) Can you share your config of this post build step? Thanks,  Artem  

          Kasper Maylann added a comment - - edited

          Hi Artem

          Hmm yes seems strange I have this issue on all my performance jobs when it clearly works when you schedule.

          So to answer your questions.

          1) I am just opening the Performance Report manually.

          2) We have a groovy script running JMeter to measure the performance. After that the groovy script invokes the performance plugin with this code:

          performanceReport compareBuildPrevious: true, configType: 'ART', errorFailedThreshold: -1, errorUnstableResponseTimeThreshold: '', errorUnstableThreshold: -1,
          failBuildIfNoResultFile: false, modeOfThreshold: false, modePerformancePerTestCase: true, modeThroughput: true, nthBuildNumber: 0, ignoreFailedBuilds: true,
          parsers: [[$class: 'JMeterParser', glob: '**/*.jtl']], relativeFailedThresholdNegative: 0.0, relativeFailedThresholdPositive: 0.0,
          relativeUnstableThresholdNegative: 0.0, relativeUnstableThresholdPositive: 0.0
          

          3) We are on Jenkins v2.89.4, performance-plugin 3.5 

          4) My performance job is not part of the normal build of the application, but is a job that only measure performance on different environments. I have added the config.xml of the job.


          Kasper Maylann added a comment - - edited Hi Artem Hmm yes seems strange I have this issue on all my performance jobs when it clearly works when you schedule. So to answer your questions. 1) I am just opening the Performance Report manually. 2) We have a groovy script running JMeter to measure the performance. After that the groovy script invokes the performance plugin with this code: performanceReport compareBuildPrevious: true , configType: 'ART' , errorFailedThreshold: -1, errorUnstableResponseTimeThreshold: '', errorUnstableThreshold: -1, failBuildIfNoResultFile: false , modeOfThreshold: false , modePerformancePerTestCase: true , modeThroughput: true , nthBuildNumber: 0, ignoreFailedBuilds: true , parsers: [[$class: 'JMeterParser' , glob: '**/*.jtl' ]], relativeFailedThresholdNegative: 0.0, relativeFailedThresholdPositive: 0.0, relativeUnstableThresholdNegative: 0.0, relativeUnstableThresholdPositive: 0.0 3) We are on Jenkins v2.89.4, performance-plugin 3.5  4) My performance job is not part of the normal build of the application, but is a job that only measure performance on different environments. I have added the config.xml of the job.    

          Artem Fedorov added a comment -

          So my job still does not reprodue it. I already have a lot of scheduled builds, but all of them have graphs

          Artem Fedorov added a comment - So my job still does not reprodue it. I already have a lot of scheduled builds, but all of them have graphs

            artem_fedorov Artem Fedorov
            maylann Kasper Maylann
            Votes:
            1 Vote for this issue
            Watchers:
            3 Start watching this issue

              Created:
              Updated: