-
Bug
-
Resolution: Unresolved
-
Blocker
-
None
-
Powered by SuggestiMate
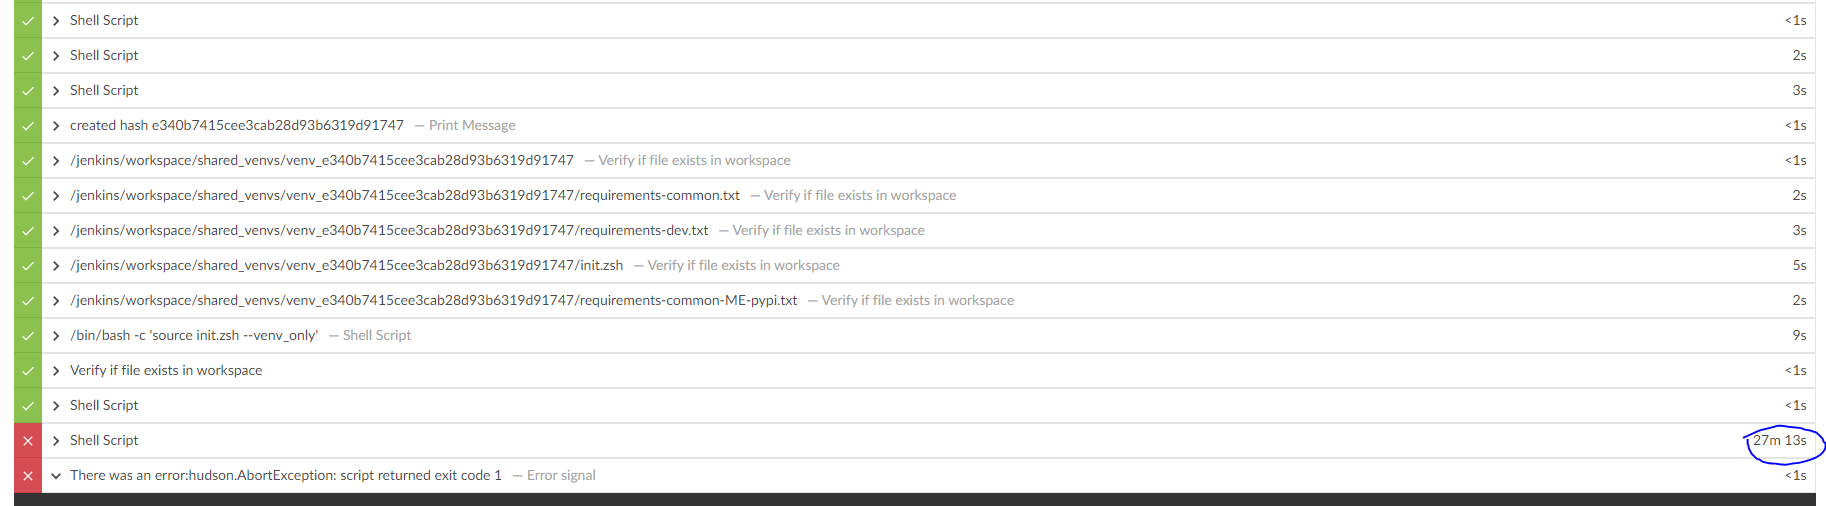
I got a negative number from pipeline workflow api, that is a duration time.
[JENKINS-49763] Duration time is incorrect in a parallel pipeline step.
Here is api output text.
{"_links":{"self":{"href":"/jenkins/job/common/lastBuild/wfapi/describe"}},"id":"201","name":"#201","status":"IN_PROGRESS","startTimeMillis":1519782004606,"endTimeMillis":1519782006142,"durationMillis":1536,"queueDurationMillis":5,"pauseDurationMillis":0,"stages":[{"_links":{"self":{"href":"/jenkins/job/common/lastBuild/execution/node/12/wfapi/describe"}},"id":"12","name":"2","execNode":"","status":"SUCCESS","startTimeMillis":1519782004715,"durationMillis":-13,"pauseDurationMillis":-13},{"_links":{"self":{"href":"/jenkins/job/common/lastBuild/execution/node/10/wfapi/describe"}},"id":"10","name":"1","execNode":"","status":"IN_PROGRESS","startTimeMillis":1519782004702,"durationMillis":1439,"pauseDurationMillis":0}]}
RestApi url is : http://localhost:8080/jenkins/job/common/lastBuild/wfapi/describe
Here is pipeline script:
node { parallel 'test': { stage('1') { sleep 60 } }, 'deply': { stage('2') { sleep 60 } } }
I've reproduced this using a similar pipeline in declarative format.
Classic Stages View
BlueOcean View
Pipeline
pipeline { agent { label "docker" } stages { stage('Step Serial') { steps { sh "sleep 5" } } stage('Step Parallel') { parallel { stage("Primary Branch") { steps { sh "sleep 4" } } stage("Secondary Branch") { steps { sh "sleep 6" } } } } } }
REST Response
/blue/rest/organizations/jenkins/pipelines/test-timings/runs/3/nodes/?limit=10000
[ { "_class": "io.jenkins.blueocean.rest.impl.pipeline.PipelineNodeImpl", "_links": { "self": { "_class": "io.jenkins.blueocean.rest.hal.Link", "href": "/blue/rest/organizations/jenkins/pipelines/test-timings/runs/3/nodes/6/" }, "actions": { "_class": "io.jenkins.blueocean.rest.hal.Link", "href": "/blue/rest/organizations/jenkins/pipelines/test-timings/runs/3/nodes/6/actions/" }, "steps": { "_class": "io.jenkins.blueocean.rest.hal.Link", "href": "/blue/rest/organizations/jenkins/pipelines/test-timings/runs/3/nodes/6/steps/" } }, "actions": [], "displayDescription": null, "displayName": "Step Serial", "durationInMillis": 5573, "id": "6", "input": null, "result": "SUCCESS", "startTime": "2019-05-14T03:31:27.174+0000", "state": "FINISHED", "type": "STAGE", "causeOfBlockage": null, "edges": [ { "_class": "io.jenkins.blueocean.rest.impl.pipeline.PipelineNodeImpl$EdgeImpl", "id": "11", "type": "STAGE" } ], "firstParent": null, "restartable": true }, { "_class": "io.jenkins.blueocean.rest.impl.pipeline.PipelineNodeImpl", "_links": { "self": { "_class": "io.jenkins.blueocean.rest.hal.Link", "href": "/blue/rest/organizations/jenkins/pipelines/test-timings/runs/3/nodes/11/" }, "actions": { "_class": "io.jenkins.blueocean.rest.hal.Link", "href": "/blue/rest/organizations/jenkins/pipelines/test-timings/runs/3/nodes/11/actions/" }, "steps": { "_class": "io.jenkins.blueocean.rest.hal.Link", "href": "/blue/rest/organizations/jenkins/pipelines/test-timings/runs/3/nodes/11/steps/" } }, "actions": [], "displayDescription": null, "displayName": "Step Parallel", "durationInMillis": 31, "id": "11", "input": null, "result": "SUCCESS", "startTime": "2019-05-14T03:31:32.802+0000", "state": "FINISHED", "type": "STAGE", "causeOfBlockage": null, "edges": [ { "_class": "io.jenkins.blueocean.rest.impl.pipeline.PipelineNodeImpl$EdgeImpl", "id": "14", "type": "PARALLEL" }, { "_class": "io.jenkins.blueocean.rest.impl.pipeline.PipelineNodeImpl$EdgeImpl", "id": "15", "type": "PARALLEL" } ], "firstParent": "6", "restartable": true }, { "_class": "io.jenkins.blueocean.rest.impl.pipeline.PipelineNodeImpl", "_links": { "self": { "_class": "io.jenkins.blueocean.rest.hal.Link", "href": "/blue/rest/organizations/jenkins/pipelines/test-timings/runs/3/nodes/14/" }, "actions": { "_class": "io.jenkins.blueocean.rest.hal.Link", "href": "/blue/rest/organizations/jenkins/pipelines/test-timings/runs/3/nodes/14/actions/" }, "steps": { "_class": "io.jenkins.blueocean.rest.hal.Link", "href": "/blue/rest/organizations/jenkins/pipelines/test-timings/runs/3/nodes/14/steps/" } }, "actions": [], "displayDescription": null, "displayName": "Primary Branch", "durationInMillis": 22, "id": "14", "input": null, "result": "SUCCESS", "startTime": "2019-05-14T03:31:32.811+0000", "state": "FINISHED", "type": "PARALLEL", "causeOfBlockage": null, "edges": [], "firstParent": "11", "restartable": false }, { "_class": "io.jenkins.blueocean.rest.impl.pipeline.PipelineNodeImpl", "_links": { "self": { "_class": "io.jenkins.blueocean.rest.hal.Link", "href": "/blue/rest/organizations/jenkins/pipelines/test-timings/runs/3/nodes/15/" }, "actions": { "_class": "io.jenkins.blueocean.rest.hal.Link", "href": "/blue/rest/organizations/jenkins/pipelines/test-timings/runs/3/nodes/15/actions/" }, "steps": { "_class": "io.jenkins.blueocean.rest.hal.Link", "href": "/blue/rest/organizations/jenkins/pipelines/test-timings/runs/3/nodes/15/steps/" } }, "actions": [], "displayDescription": null, "displayName": "Secondary Branch", "durationInMillis": 19, "id": "15", "input": null, "result": "SUCCESS", "startTime": "2019-05-14T03:31:32.814+0000", "state": "FINISHED", "type": "PARALLEL", "causeOfBlockage": null, "edges": [], "firstParent": "11", "restartable": false } ]
Note: my example doesn't show negatives, but does show the blueocean endpoint returning invalid timings for parallel stages, and not accumulating the time for the overall stage correctly. I suspect they're all issues in a similar section of code, so will leave my notes here.
Hello!
We have a similar issue:
We've noticed that the stage duration is changed to a very very small value once the pipeline completes.
During runtime the value is correct but it after it's completed the runtime is just some seconds.
Please fix.
svanoort Can someone from the team take a look at this please?
It's open for nearly 3 years. Many teams have this issue.
Hi Team,
Our jenkins is running Jenkins 2.349 and we also evidenced this issue some nodes wfapi/describe have durationMillis < 0
Could you please attach a screenshot so that we could triage?