-
Type:
Bug
-
Resolution: Fixed
-
Priority:
 Major
Major
-
Component/s: prometheus-plugin
-
None
-
Environment:Jenkins ver. 2.176.2
Prometheus metrics plugin
2.0.6
OS: Ubuntu 16.04 / x86_64 x86_64 GNU/Linux
^ all nodes, master and worker, using the same
Jenkins is running inside a Docker container. The agents on each node are running directly on VMs in AWS and GCP.
Installation: Master is run in a Docker container. Slave agent is via SSH.
Web browser: N/A. It was seen on Chrome Latest, but these error logs are taken from the docker container running the master node, directly.Jenkins ver. 2.176.2 Prometheus metrics plugin 2.0.6 OS: Ubuntu 16.04 / x86_64 x86_64 GNU/Linux ^ all nodes, master and worker, using the same Jenkins is running inside a Docker container. The agents on each node are running directly on VMs in AWS and GCP. Installation: Master is run in a Docker container. Slave agent is via SSH. Web browser: N/A. It was seen on Chrome Latest, but these error logs are taken from the docker container running the master node, directly.
Overview
=========
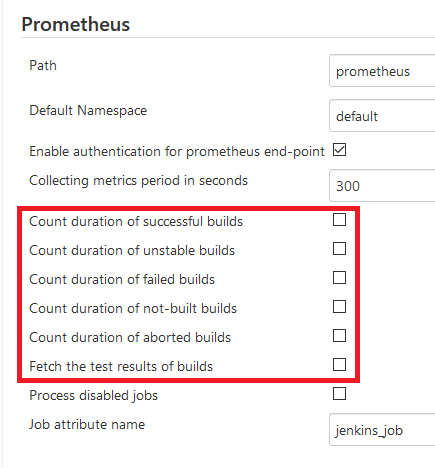
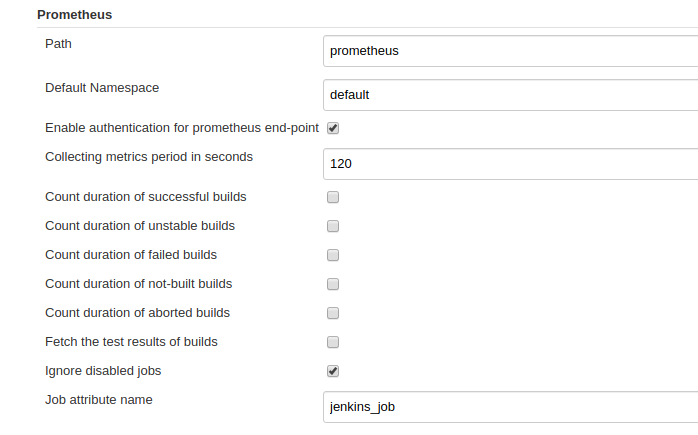
After installation of the Prometheus Plugin, we performed the following actions:
1. Restart Jenkins => Jenkins started gracefully, and jobs began running as expected
2. Navigate to <jenkins-url>/prometheus, and observe that there is no data being written there. Wait ~ 20 minutes with no change.
3. Investigate Jenkins logs on the master and find critical errors, pasted below.
4. Turn off Prometheus Plugin and restart Jenkins, because: (a) no data as captured; and (b) the error messages were alarming.
The message we are most concerned about is:
```
SEVERE: A thread (prometheus_async_worker thread/48636) died unexpectedly due to an uncaught exception, this may leave your Jenkins in a bad way and is usually indicative of a bug in the code.
```
Errors (longer form)
-------------------------------
The specific message we are seeing, as soon as jobs begin running, is:
```
Oct 28, 2019 2:48:34 PM org.jenkinsci.plugins.workflow.cps.CpsFlowExecution createPlaceholderNodesOct 28, 2019 2:48:34 PM org.jenkinsci.plugins.workflow.cps.CpsFlowExecution createPlaceholderNodesINFO: Creating placeholder flownodes for execution: CpsFlowExecution[Owner[redacted]]--WARNING: Error initializing storage and loading nodes, will try to create placeholders for: CpsFlowExecution[Owner[redacted]]java.io.IOException: Tried to load head FlowNodes for execution Owner[redacted] but FlowNode was not found in storage for head id:FlowNodeId 1:1469 at org.jenkinsci.plugins.workflow.cps.CpsFlowExecution.initializeStorage(CpsFlowExecution.java:679) at org.jenkinsci.plugins.workflow.cps.CpsFlowExecution.onLoad(CpsFlowExecution.java:716) at org.jenkinsci.plugins.workflow.job.WorkflowRun.getExecution(WorkflowRun.java:662) at org.jenkinsci.plugins.prometheus.JobCollector.appendJobMetrics(JobCollector.java:270) at org.jenkinsci.plugins.prometheus.JobCollector.lambda$collect$0(JobCollector.java:176) at org.jenkinsci.plugins.prometheus.util.Jobs.forEachJob(Jobs.java:20) at org.jenkinsci.plugins.prometheus.JobCollector.collect(JobCollector.java:159) at io.prometheus.client.CollectorRegistry$MetricFamilySamplesEnumeration.findNextElement(CollectorRegistry.java:183) at io.prometheus.client.CollectorRegistry$MetricFamilySamplesEnumeration.nextElement(CollectorRegistry.java:216) at io.prometheus.client.CollectorRegistry$MetricFamilySamplesEnumeration.nextElement(CollectorRegistry.java:137) at io.prometheus.client.exporter.common.TextFormat.write004(TextFormat.java:22) at org.jenkinsci.plugins.prometheus.service.DefaultPrometheusMetrics.collectMetrics(DefaultPrometheusMetrics.java:43) at org.jenkinsci.plugins.prometheus.service.PrometheusAsyncWorker.execute(PrometheusAsyncWorker.java:40) at hudson.model.AsyncPeriodicWork$1.run(AsyncPeriodicWork.java:101) at java.lang.Thread.run(Thread.java:748)
```
Followed by...
Oct 28, 2019 3:08:00 PM hudson.init.impl.InstallUncaughtExceptionHandler$DefaultUncaughtExceptionHandler uncaughtException
SEVERE: A thread (prometheus_async_worker thread/48636) died unexpectedly due to an uncaught exception, this may leave your Jenkins in a bad way and is usually indicative of a bug in the code.
java.lang.StackOverflowError
at java.util.TreeMap.put(TreeMap.java:568)
at org.jenkinsci.plugins.prometheus.util.FlowNodes.traverseTree(FlowNodes.java:44)
at org.jenkinsci.plugins.prometheus.util.FlowNodes.traverseTree(FlowNodes.java:49)
at org.jenkinsci.plugins.prometheus.util.FlowNodes.traverseTree(FlowNodes.java:49)
at org.jenkinsci.plugins.prometheus.util.FlowNodes.traverseTree(FlowNodes.java:49)
at org.jenkinsci.plugins.prometheus.util.FlowNodes.traverseTree(FlowNodes.java:49)
at org.jenkinsci.plugins.prometheus.util.FlowNodes.traverseTree(FlowNodes.java:49)
at org.jenkinsci.plugins.prometheus.util.FlowNodes.traverseTree(FlowNodes.java:49)
at org.jenkinsci.plugins.prometheus.util.FlowNodes.traverseTree(FlowNodes.java:49)
at org.jenkinsci.plugins.prometheus.util.FlowNodes.traverseTree(FlowNodes.java:49)
at org.jenkinsci.plugins.prometheus.util.FlowNodes.traverseTree(FlowNodes.java:49)
at org.jenkinsci.plugins.prometheus.util.FlowNodes.traverseTree(FlowNodes.java:49)
This message is repeated throughout the logs many times.
We believe this is the reason why no valid Prometheus metrics are reported.
Does that sound correct, and is there any way we can validate/verify/fix?