-
Type:
Bug
-
Resolution: Fixed
-
Priority:
Major
-
Environment:Centos 7
Jenkins LTSS 2.190.3
-
1.9.8
I tagged both components because I'm not sure which is triggering this behavior.
We installed the visualizer plugin on Friday (its awesome btw!). The Update Center was used to apply the plugin, the only dependency added was the "down stream build cache" plugin.
Everything seemed to be functioning fine after that. The flowcharts looked great. Exactly what we've been looking for.
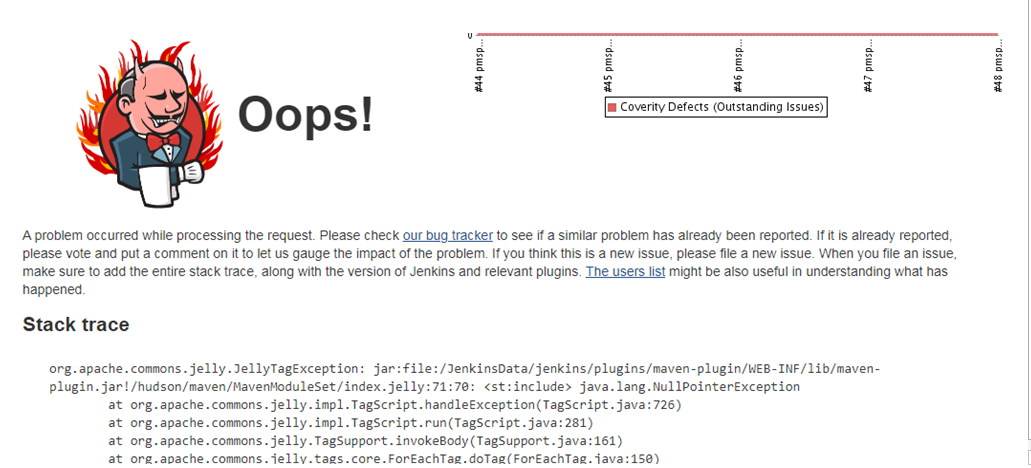
I come in Monday and I'm seeing the jenkins "oops!" screen all over the place.

16-Dec-2019 07:42:55.880 SEVERE [Handling GET /job/lb/job/ecs/job/ECS_12.10.0/74/yabv/buildFlow from 10.4.160.104 : https-jsse-nio-9443-exec-16] org.apache.catalina.core.ApplicationContext.log Error while serving https://************/74/yabv/buildFlow
java.lang.reflect.InvocationTargetException
at org.kohsuke.stapler.Function$MethodFunction.invoke(Function.java:400)
at org.kohsuke.stapler.Function$InstanceFunction.invoke(Function.java:408)
at org.kohsuke.stapler.Function.bindAndInvoke(Function.java:212)
<...>
at org.apache.tomcat.util.threads.TaskThread$WrappingRunnable.run(TaskThread.java:61)
at java.lang.Thread.run(Thread.java:748)
Caused by: java.lang.NullPointerException
I've attached a sample dump from the logs (jenkins-issue.txt), and a dump from the screen of what a page outputs (jenkins-issue-sg.txt).
These plugin additions where the only change in my system in the last week or so. I tried a Jenkins service restart but the problem persisted.
Disabling the two new plugins returned my system to normal.
We'd love to get this functionality back. If there is an information I can provide to help debug let me know.
