-
Type:
Improvement
-
Resolution: Unresolved
-
Priority:
 Minor
Minor
-
Component/s: junit-plugin
-
Environment:Jenkins LTS : 2.249.1
junit plugin : 1.37
xunit plugin : 2.3.9
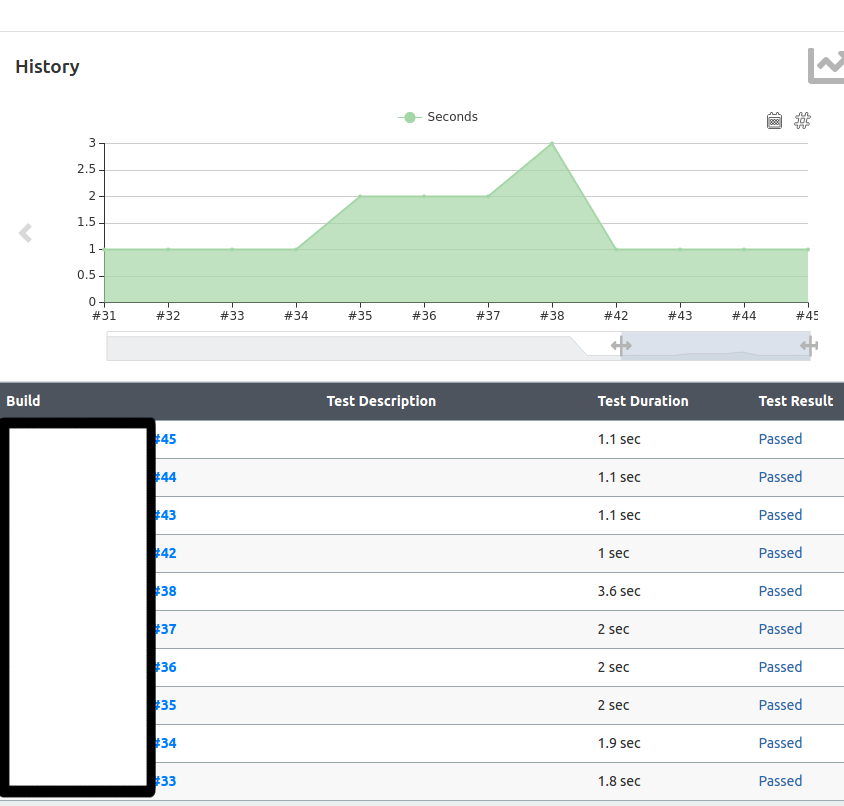
When looking at the impact of successive changes (builds) on the runtime duration of one specific test, I notice the history graph is truncating the duration to seconds.
See attachment:
- data table shows : 1.8 / 1.9 / 2.0 s
- graph shows: 1.0 / 1.0 / 2.0 s
Note: this data is from googletest XML files, parsed by xunit plugin. I'm not sure if the graph in Jenkins is drawn by xunit plugin or junit plugin.

