-
Type:
Bug
-
Resolution: Fixed
-
Priority:
 Minor
Minor
-
Component/s: prometheus-plugin
-
None
-
Environment:JENKINS_VERSION 2.249.2
Working Prometheus Plugin Version:
2.0.7
Broken Prometheus Plugin Version:
2.0.8
Steps to reproduce
How can we reproduce the issue
Install 2.0.8 plugin
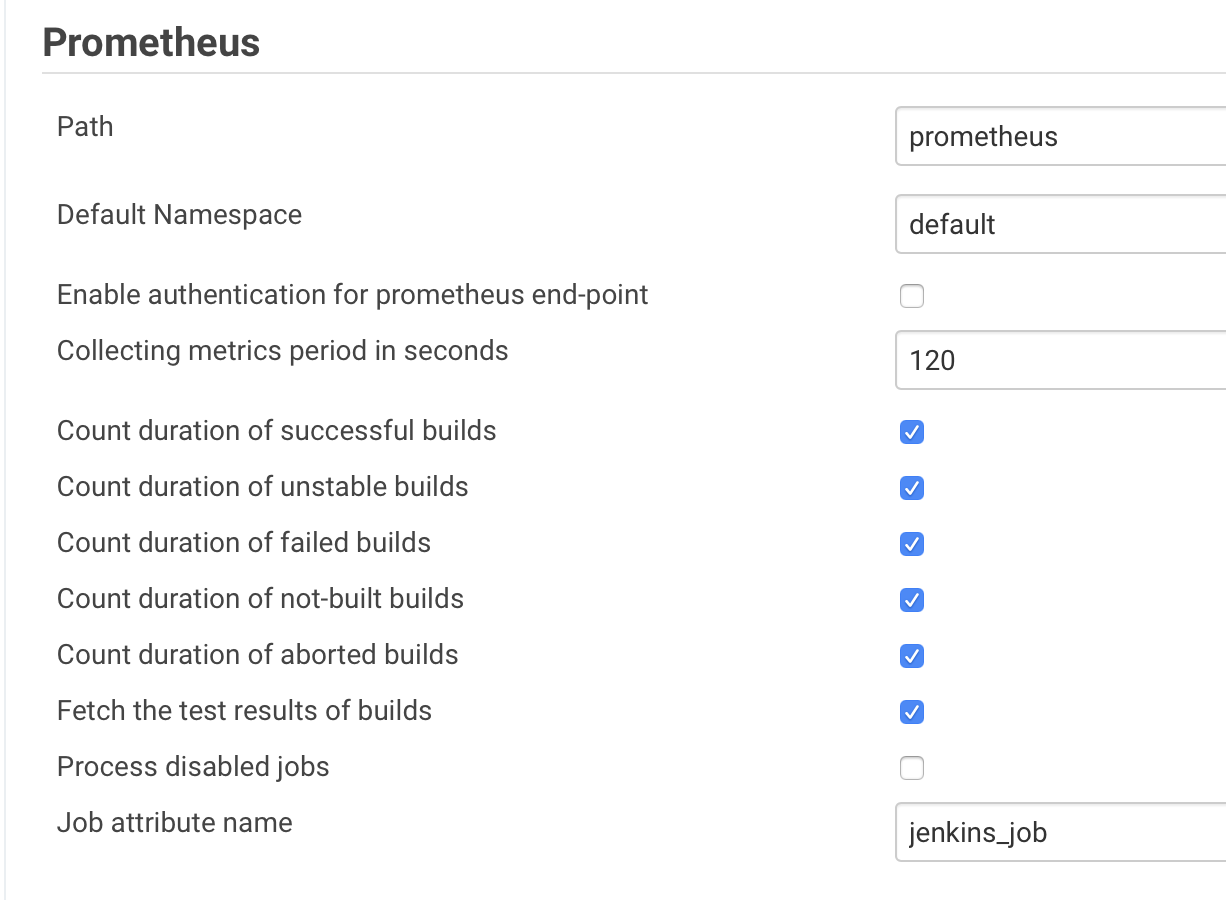
Expected behaviour
Be able to access url/prometheus and not see a blank screen but see usual metrics + job stage metrics
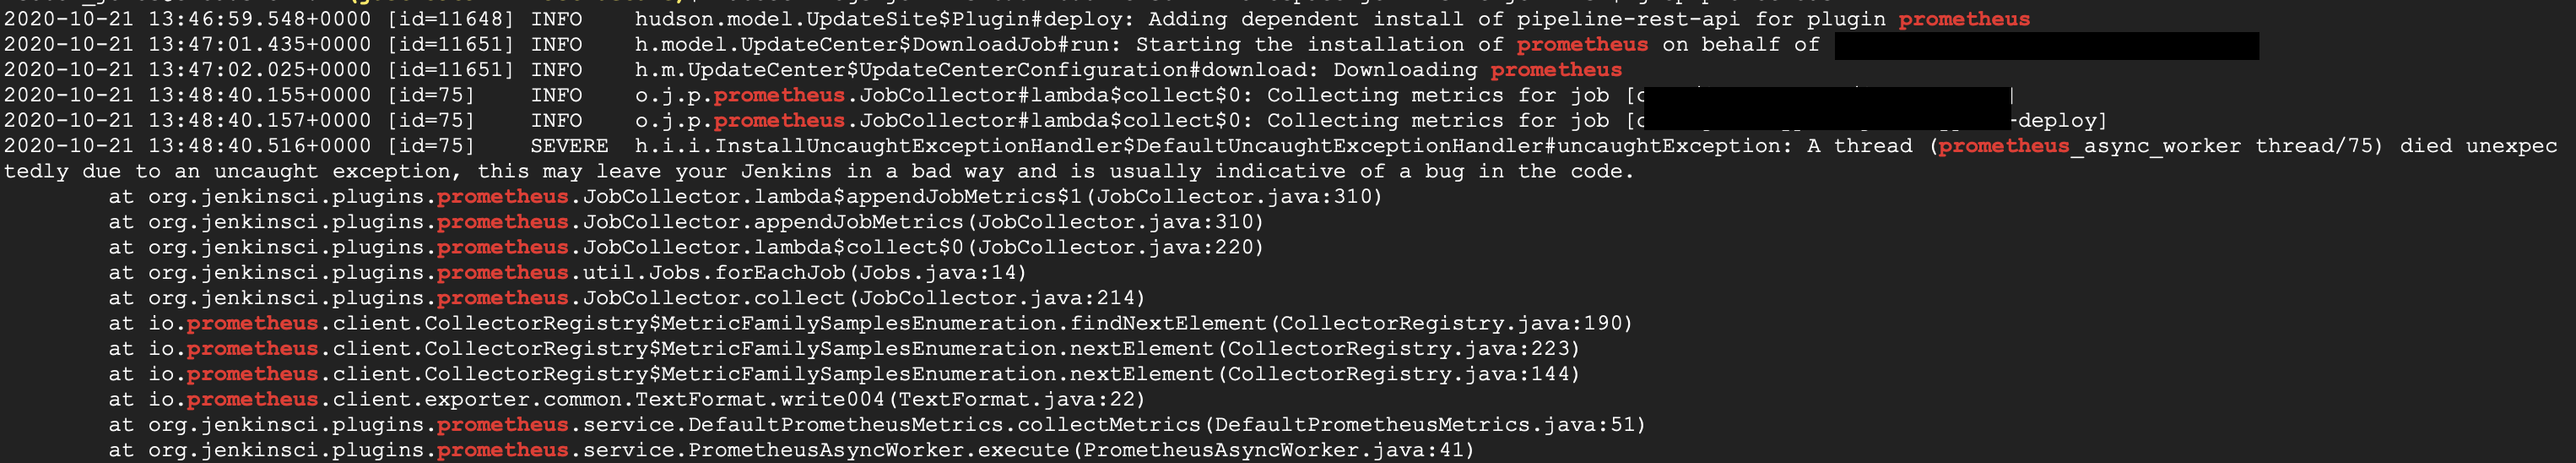
Actual behaviour
When accessing url/prometheus it returns blank. Receive the following error in Jenkins logs:
2020-10-21 13:58:40.143+0000 [id=146] INFO o.j.p.prometheus.JobCollector#lambda$collect$0: Collecting metrics for job [core/just-cypher/just-cypher]2020-10-21 13:58:40.144+0000 [id=146] INFO o.j.p.prometheus.JobCollector#lambda$collect$0: Collecting metrics for job [core/just-cypher/just-cypher-deploy]2020-10-21 13:58:40.144+0000 [id=146] SEVERE h.i.i.InstallUncaughtExceptionHandler$DefaultUncaughtExceptionHandler#uncaughtException: A thread (prometheus_async_worker thread/146) died unexpectedly due to an uncaught exception, this may leave your Jenkins in a bad way and is usually indicative of a bug in the code. at org.jenkinsci.plugins.prometheus.JobCollector.lambda$appendJobMetrics$1(JobCollector.java:310) at org.jenkinsci.plugins.prometheus.JobCollector.appendJobMetrics(JobCollector.java:310) at org.jenkinsci.plugins.prometheus.JobCollector.lambda$collect$0(JobCollector.java:220) at org.jenkinsci.plugins.prometheus.util.Jobs.forEachJob(Jobs.java:14) at org.jenkinsci.plugins.prometheus.JobCollector.collect(JobCollector.java:214) at io.prometheus.client.CollectorRegistry$MetricFamilySamplesEnumeration.findNextElement(CollectorRegistry.java:190) at io.prometheus.client.CollectorRegistry$MetricFamilySamplesEnumeration.nextElement(CollectorRegistry.java:223) at io.prometheus.client.CollectorRegistry$MetricFamilySamplesEnumeration.nextElement(CollectorRegistry.java:144) at io.prometheus.client.exporter.common.TextFormat.write004(TextFormat.java:22) at org.jenkinsci.plugins.prometheus.service.DefaultPrometheusMetrics.collectMetrics(DefaultPrometheusMetrics.java:51) at org.jenkinsci.plugins.prometheus.service.PrometheusAsyncWorker.execute(PrometheusAsyncWorker.java:41)2020-10-21 14:00:40.144+0000 [id=156] INFO o.j.p.prometheus.JobCollector#lambda$collect$0: Collecting metrics for job [core/just-cypher/just-cypher
Server configuration
*Operating system*: jenkins docker container on K8
*Jenkins Version*: JENKINS_VERSION 2.249.2
*Plugin Version*: 2.0.8
Notify
@markyjackson-taulia