-
Type:
Bug
-
Resolution: Not A Defect
-
Priority:
 Minor
Minor
-
Component/s: plot-plugin
Hello,
first, thanks for making Jenkins and keeping it great!
I'm using the plot plugin to plot multiple graphs, with data originating from the same csv file (the job writes a csv file with all the stats I want to plot, then I just extract the ones I want to plot for each plot – it doesn't make sense to have everything in a single plot)
The problem is that... it only seems to update one of the plot at the time, here's an example with 2 plots:
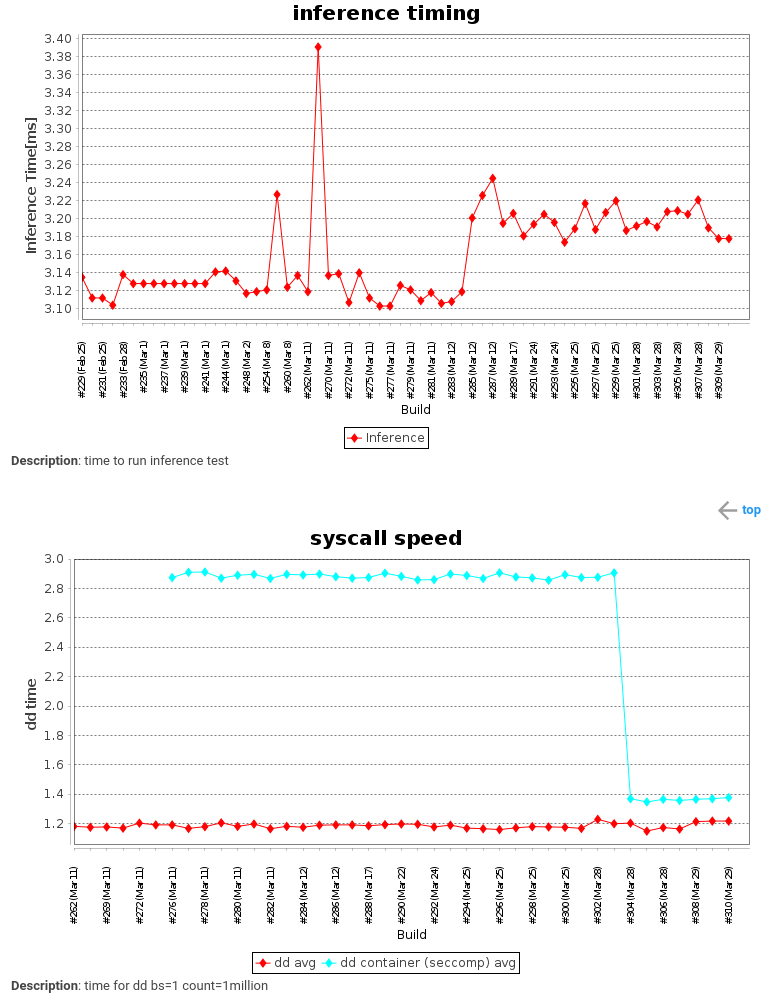
(262 was done with two files, everything after that is alternated)
The source files does contain both values all the time (example below), it's just picking either everytime.
dd_avg,dd_stdev,dd container (seccomp)_avg,dd container (seccomp)_stdev,Inference
1.5150000000000001,0.007071067811865481,3.165,0.007071067811865324,3.187
Where the first graph plots the "Inference" column, and the second grpah plots "dd_avg" and "dd container (seccomp)_avg" (I didn't figure how to nicely add stdev to the same plot so it's not plotted right now...)
I'm not sure if it's a bug in my config (in which case things might be made clearer) or a bug in the plugin, so I'll describe my config as much as possible:
- both graphs are defined in the same post-build action, as two different plot groups
- both graphs have the same option set, in particular if that's relevant Keep records for deleted builds is set
- both graphs use the same "Data series file", with "load data from csv file" "Include columns by name", each picking their appropriate column in "CSV Exclusion values". I tried "Display original csv above plot" once and it seems to only include the relevant portion of the original csv, so that data is extracted from each alternate run appropriately.
Here's the relevant section exported by the jobConfigHistory plugin:
  <publishers>
    <hudson.plugins.plot.PlotPublisher plugin="plot@2.1.10">
      <plots>
        <hudson.plugins.plot.Plot>
          <title>inference timing</title>
          <description>time to run inference test</description>
          <yaxis>Inference Time[ms]</yaxis>
          <series>
            <hudson.plugins.plot.CSVSeries>
              <file>stats.csv</file>
              <label/>
              <fileType>csv</fileType>
              <strExclusionSet>
                <string>Inference</string>
              </strExclusionSet>
              <inclusionFlag>INCLUDE_BY_STRING</inclusionFlag>
              <exclusionValues>Inference</exclusionValues>
              <exclusionValuesList class="java.util.Arrays$ArrayList">
                <a class="string-array">
                  <string>Inference</string>
                </a>
              </exclusionValuesList>
              <url/>
              <displayTableFlag>false</displayTableFlag>
            </hudson.plugins.plot.CSVSeries>
          </series>
          <group>perf</group>
          <numBuilds>300</numBuilds>
          <csvFileName>plot-1097525250077460688.csv</csvFileName>
          <csvLastModification>0</csvLastModification>
          <style>line</style>
          <useDescr>true</useDescr>
          <keepRecords>true</keepRecords>
          <exclZero>true</exclZero>
          <logarithmic>false</logarithmic>
          <yaxisMinimum/>
          <yaxisMaximum/>
        </hudson.plugins.plot.Plot>
        <hudson.plugins.plot.Plot>
          <title>syscall speed</title>
          <description>time for dd bs=1 count=1million</description>
          <yaxis>dd time</yaxis>
          <series>
            <hudson.plugins.plot.CSVSeries>
              <file>stats.csv</file>
              <label/>
              <fileType>csv</fileType>
              <strExclusionSet>
                <string>dd avg</string>
                <string>dd container (seccomp) avg</string>
              </strExclusionSet>
              <inclusionFlag>INCLUDE_BY_STRING</inclusionFlag>
              <exclusionValues>dd avg,dd container (seccomp) avg</exclusionValues>
              <exclusionValuesList class="java.util.Arrays$ArrayList">
                <a class="string-array">
                  <string>dd avg</string>
                  <string>dd container (seccomp) avg</string>
                </a>
              </exclusionValuesList>
              <url/>
              <displayTableFlag>false</displayTableFlag>
            </hudson.plugins.plot.CSVSeries>
          </series>
          <group>perf</group>
          <numBuilds>300</numBuilds>
          <csvFileName>plot-3547454240770203476.csv</csvFileName>
          <csvLastModification>0</csvLastModification>
          <style>line</style>
          <useDescr>true</useDescr>
          <keepRecords>true</keepRecords>
          <exclZero>true</exclZero>
          <logarithmic>false</logarithmic>
          <yaxisMinimum/>
          <yaxisMaximum/>
        </hudson.plugins.plot.Plot>
      </plots>
    </hudson.plugins.plot.PlotPublisher>
  </publishers>
Thanks!


