-
Type:
Bug
-
Resolution: Unresolved
-
Priority:
 Major
Major
-
Component/s: core
The "Response Time" of a Nodes (i.e. ResponseTimeMonitor) sometimes displays a response time is incorrect and related to other node(s). In those case, several nodes - even if response time are very different - would show the same response time.
Evidence
One can create a LoggingChannelListener and attach it to the agent channels, for example:
import hudson.remoting.Channel
import hudson.remoting.Command
import hudson.remoting.Request
import hudson.remoting.Response
import org.jenkinsci.remoting.util.LoggingChannelListener

import java.util.logging.Level
import java.util.logging.Logger

//new LoggingChannelListener(Logger.getLogger(Channel.Listener.class.getName()), Level.FINEST)

Channel.Listener myListener = new LoggingChannelListener(Logger.getLogger(Channel.Listener.class.getName()), Level.FINEST) {

  @Override
  void onClosed(Channel channel, IOException cause) {
    super.onClosed(channel, cause)
  }

  @Override
  void onRead(Channel channel, Command cmd, long blockSize) {
    super.onRead(channel, cmd, blockSize)
  }

  @Override
  void onWrite(Channel channel, Command cmd, long blockSize) {
    super.onWrite(channel, cmd, blockSize)
  }

  @Override
  void onResponse(Channel channel, Request<?, ?> req, Response<?, ?> rsp, long totalTime) {
    super.onResponse(channel, req, rsp, totalTime)
  }

  @Override
  void onJar(Channel channel, File jar) {
    super.onJar(channel, jar)
  }
}

((Channel)jenkins.model.Jenkins.get().getNode("seco-3902-local").getChannel()).addListener(myListener)
((Channel)jenkins.model.Jenkins.get().getNode("test-1").getChannel()).addListener(myListener)
We can clearly see in the log recorded that the response of the "local" (closest) agent is a lot shorter than the agent that is distant. ~3ms vs ~230ms:
FINEST	o.j.r.u.LoggingChannelListener#onWrite: JNLP4-connect connection from 123.123.123.123/123.123.123.123:49288 wrote 2325: UserRequest:hudson.node_monitors.ResponseTimeMonitor$Step1@640b41bb
FINEST	o.j.r.u.LoggingChannelListener#onWrite: test-1 wrote 2341: UserRequest:hudson.node_monitors.ResponseTimeMonitor$Step1@1f058853
FINEST	o.j.r.u.LoggingChannelListener#onResponse: JNLP4-connect connection from 123.123.123.123/123.123.123.123:49288 received response in 3ms: UserRequest:hudson.node_monitors.ResponseTimeMonitor$Step1@640b41bb
FINEST	o.j.r.u.LoggingChannelListener#onResponse: test-1 received response in 229ms: UserRequest:hudson.node_monitors.ResponseTimeMonitor$Step1@1f058853
FINEST	o.j.r.u.LoggingChannelListener#onWrite: JNLP4-connect connection from 123.123.123.123/123.123.123.123:49288 wrote 2333: UserRequest:hudson.node_monitors.ResponseTimeMonitor$Step1@715021e0
FINEST	o.j.r.u.LoggingChannelListener#onWrite: test-1 wrote 2341: UserRequest:hudson.node_monitors.ResponseTimeMonitor$Step1@6c217595
FINEST	o.j.r.u.LoggingChannelListener#onResponse: JNLP4-connect connection from 123.123.123.123/123.123.123.123:49288 received response in 3ms: UserRequest:hudson.node_monitors.ResponseTimeMonitor$Step1@715021e0
FINEST	o.j.r.u.LoggingChannelListener#onResponse: test-1 received response in 230ms: UserRequest:hudson.node_monitors.ResponseTimeMonitor$Step1@6c217595
FINEST	o.j.r.u.LoggingChannelListener#onWrite: JNLP4-connect connection from 123.123.123.123/123.123.123.123:49288 wrote 2341: UserRequest:hudson.node_monitors.ResponseTimeMonitor$Step1@7d1392ec
FINEST	o.j.r.u.LoggingChannelListener#onWrite: test-1 wrote 2341: UserRequest:hudson.node_monitors.ResponseTimeMonitor$Step1@76d6906e
FINEST	o.j.r.u.LoggingChannelListener#onResponse: JNLP4-connect connection from 123.123.123.123/123.123.123.123:49288 received response in 6ms: UserRequest:hudson.node_monitors.ResponseTimeMonitor$Step1@7d1392ec
FINEST	o.j.r.u.LoggingChannelListener#onResponse: test-1 received response in 230ms: UserRequest:hudson.node_monitors.ResponseTimeMonitor$Step1@76d6906e
FINEST	o.j.r.u.LoggingChannelListener#onWrite: JNLP4-connect connection from 123.123.123.123/123.123.123.123:49288 wrote 2341: UserRequest:hudson.node_monitors.ResponseTimeMonitor$Step1@6f4c596e
FINEST	o.j.r.u.LoggingChannelListener#onWrite: test-1 wrote 2341: UserRequest:hudson.node_monitors.ResponseTimeMonitor$Step1@316ada04
FINEST	o.j.r.u.LoggingChannelListener#onResponse: JNLP4-connect connection from 123.123.123.123/123.123.123.123:49288 received response in 2ms: UserRequest:hudson.node_monitors.ResponseTimeMonitor$Step1@6f4c596e
FINEST	o.j.r.u.LoggingChannelListener#onResponse: test-1 received response in 230ms: UserRequest:hudson.node_monitors.ResponseTimeMonitor$Step1@316ada04
FINEST	o.j.r.u.LoggingChannelListener#onWrite: JNLP4-connect connection from 123.123.123.123/123.123.123.123:49288 wrote 2340: UserRequest:hudson.node_monitors.ResponseTimeMonitor$Step1@bd55be0
FINEST	o.j.r.u.LoggingChannelListener#onWrite: test-1 wrote 2341: UserRequest:hudson.node_monitors.ResponseTimeMonitor$Step1@6c941e28
FINEST	o.j.r.u.LoggingChannelListener#onResponse: JNLP4-connect connection from 123.123.123.123/123.123.123.123:49288 received response in 2ms: UserRequest:hudson.node_monitors.ResponseTimeMonitor$Step1@bd55be0
FINEST	o.j.r.u.LoggingChannelListener#onResponse: test-1 received response in 231ms: UserRequest:hudson.node_monitors.ResponseTimeMonitor$Step1@6c941e28
The Response Time monitor takes as long as the slowest agent:
FINE	h.n.AbstractNodeMonitorDescriptor$Record#run: Node monitoring Response Time completed in 231ms
FINE	h.n.AbstractNodeMonitorDescriptor$Record#run: Node monitoring Response Time completed in 231ms
FINE	h.n.AbstractNodeMonitorDescriptor$Record#run: Node monitoring Response Time completed in 231ms
FINE	h.n.AbstractNodeMonitorDescriptor$Record#run: Node monitoring Response Time completed in 231ms
FINE	h.n.AbstractNodeMonitorDescriptor$Record#run: Node monitoring Response Time completed in 232ms
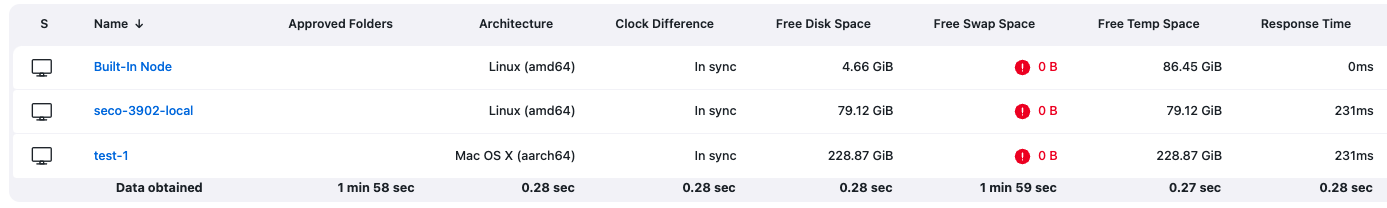
But the UI reports 231 for both agents which is wrong:

How to Reproduce
I was able to reproduce this several times but not always.. I connect agents that are connected in different networks. One really close to the controller and one that is located in a distant network. In my scenario, a remote Kubernetes cluster with a permanent agent located within that cluster. And an agent running in a different region and connecting via websocket through ingress.
- Spin up a Controller (use the system property hudson.node_monitors.AbstractNodeMonitorDescriptor.periodMinutes=1 to run the monitor more frequently, otherwise by default it runs every hour)
- Create a Permanent Agent that is very close to the controller (in my case, response time is 2/3ms)
- Create a Permanent Agent that is in a distant network (in my case, a local agent)
- Check the Nodes page Response Time
This does not consistently reproduce the problem and I haven't identified the exact scenario. Trying to delete / recreate the agent sometimes reproduce it.. I believe this happens when the agent connect at almost the same time. So try to have the 2 agent connect at the same time (and have their first Response Time result produced within the same periodic sequence)..
- links to

