-
Type:
Bug
-
Resolution: Fixed
-
Priority:
 Major
Major
-
Component/s: prometheus-plugin
-
None
-
Environment:Jenkins 2.452.3
Prometheus metrics 779.vb_59179a_27643 (and newer)
Coverage Plugin 1.16.1
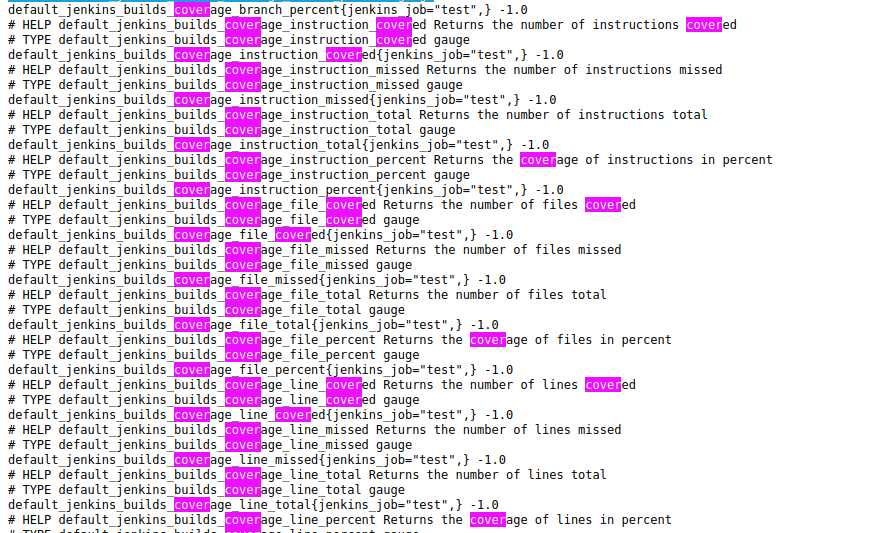
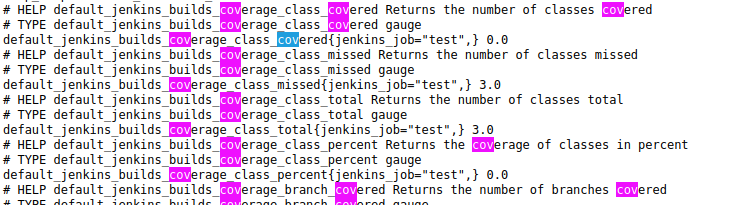
I am using the Prometheus metrics plug-in for gathering the metrics provided by the Coverage Plugin. Since version 779.vb_59179a_27643 of the former, all metrics of type default_jenkins_builds_coverage<type>covered are not provided anymore via the default endpoint /prometheus/.
The same problem occurs with the latest release 780.v7c50a_d288424. After rolling back to version 773.v3b_62d8178eec, the aforementioned metrics are provided again. Since I was also affected by the bug in release 778.ve1c932a_ff24f preventing the Jenkins instance from starting (see GitHub issues), I cannot make any guess whether the issue occured first in this release or the one following it (779.vb_59179a_27643).
Another note: With the newer versions, other job-specific metrics like default_jenkins_builds_duration_milliseconds_summary_created are still provided. Only the coverage-specific metrics seem to be affected.
