-
Type:
Bug
-
Resolution: Won't Fix
-
Priority:
 Minor
Minor
-
Component/s: blueocean-plugin
-
Environment:Jenkins 2.516.1, Blue Ocean v.1.27.21, Blue Ocean Pipeline Editor v1.27.21, Dashboard for Blue Ocean v.1.27.21 and all related plugins to Blue Ocean in that particular version (couple of older ver. back has the issue also)
We have identified a significant visualization issue with the BlueOcean Pipeline Run Details View that affects the display of dynamically generated nested parallel stages. The broken view renders the pipeline execution details unusable, while the Pipeline Overview continues to function correctly, highlighting the inconsistency within the BlueOcean plugin.
Issue Description
The BlueOcean Pipeline Run Details View fails to properly render pipelines that use dynamically created nested parallel stages within a script block. This appears to be a specific issue with how BlueOcean interprets and visualizes complex pipeline structures that combine:
- Dynamic stage creation using script blocks
- Nested parallel execution with parallel parallelStages
- Multiple stages within each parallel branch
- Post-build actions and downstream job triggering
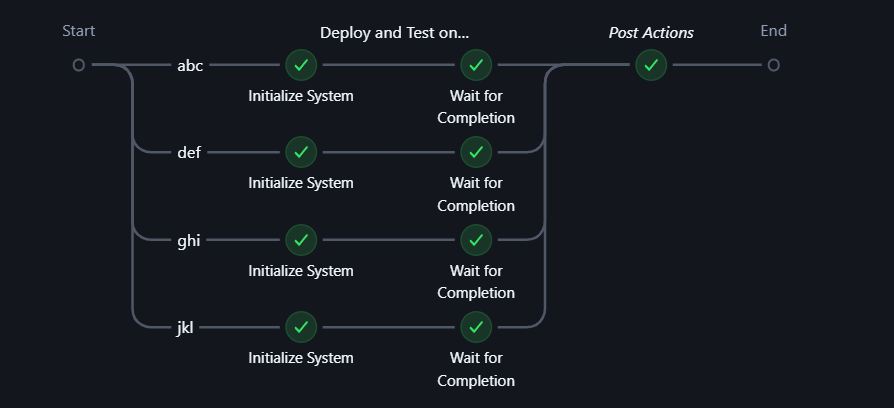
Expected vs Actual Behavior
Expected:
- All dynamically created parallel stages should be visible in the Run Details View
- Nested stages within each parallel branch should be clearly displayed
- Progress indicators should work for each stage
- Log output should be accessible for individual stages
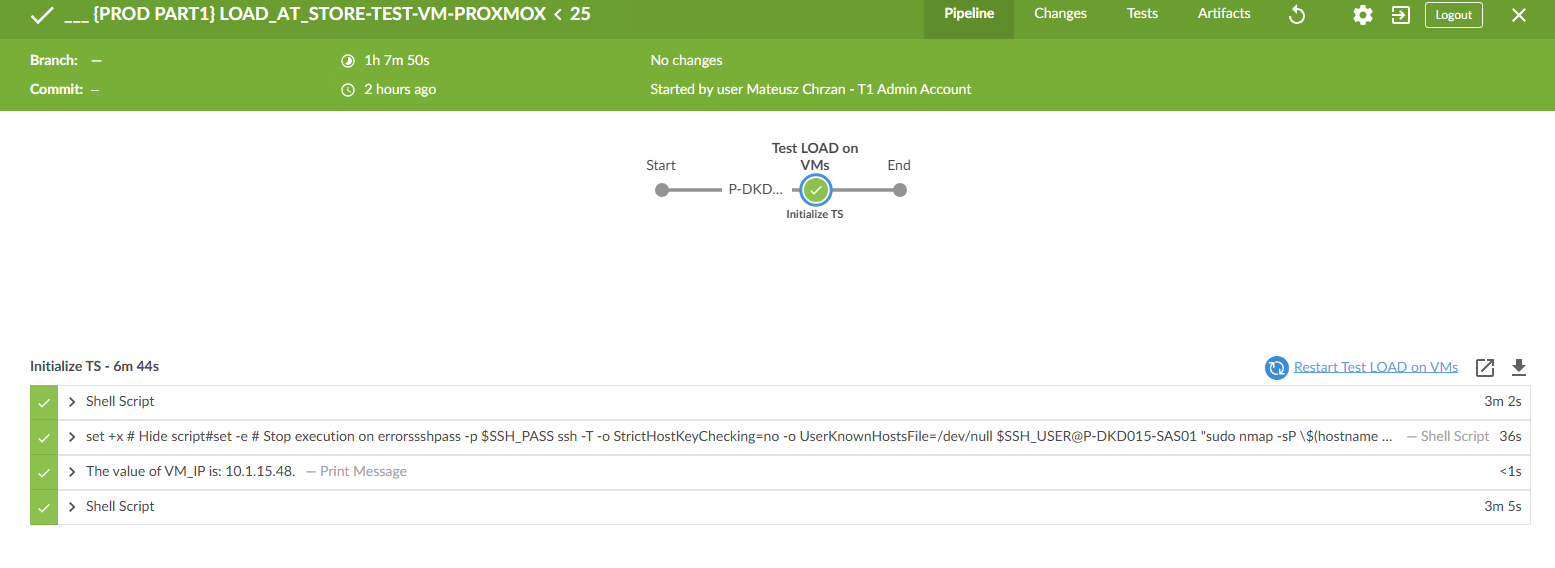
Actual:
- Pipeline visualization appears broken or incomplete
- Nested stages are not properly rendered
- Navigation between stages is impaired
- Overall user experience is severely degraded
This issue significantly impacts our development workflow as:
- Developers cannot effectively monitor pipeline execution progress
- Debugging failed builds becomes extremely difficult
- Log navigation is impaired or impossible
- Team productivity is reduced due to poor visibility into pipeline execution
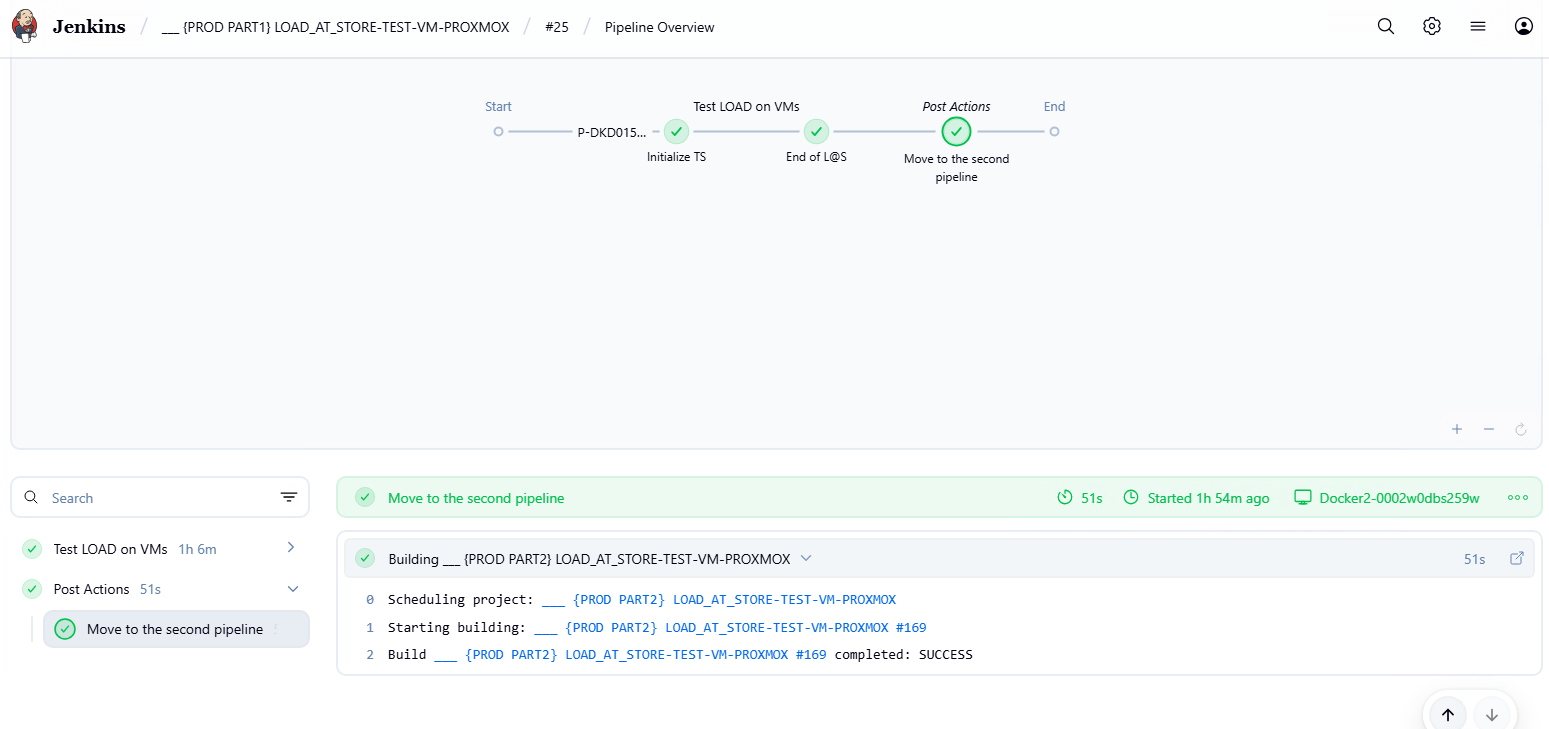
Workaround
Currently, we rely on the classic Jenkins UI and Pipeline Overview for monitoring, but this limits the benefits of the BlueOcean user experience that our team prefers.
Request
We would appreciate investigation into this visualization issue, as this pipeline pattern, while perhaps not conventional, represents a valid use case for dynamic parallel execution that should be supported by BlueOcean's visualization engine.
Pipeline Structure
pipeline {
    agent {
        label 'BUILD_AGENT'
    }
    options {
        timeout(time: 24, unit: 'HOURS')
    }
    parameters {
        string(name: 'TARGET_HOSTS', description: 'Enter target host names, SEPARATED BY COMMAS!')
        choice(name: 'VM_ID', choices: ['103', '102'], description: 'Select VM ID:')
    }
    stages {
        stage("Deploy and Test on VMs") {
            options {
                timeout(time: 120, unit: 'MINUTES')
            }
            steps {
                script {
                    def targetHosts = params.TARGET_HOSTS.split(',')
                    def parallelStages = [:]

                    targetHosts.each { host ->
                        parallelStages["${host}"] = {
                            stage("Initialize System") {
                                echo "Initializing VM ${params.VM_ID} on ${host}"
                                // VM creation and setup logic
                                sh "vm_deploy_script.sh ${host} ${params.VM_ID}"
                            }
                            stage("Wait for Completion") {
                                echo "Waiting for deployment completion on ${host}"
                                // Monitor deployment progress
                                sh "monitor_deployment.sh ${host} ${params.VM_ID}"
                            }
                        }
                    }
                    parallel parallelStages
                }
            }
        }
    }
    post {
        always {
            cleanWs()
        }
        success {
            build(
                job: 'NEXT_PIPELINE_JOB',
                parameters: [
                    string(name: 'TARGET_HOSTS', value: params.TARGET_HOSTS),
                    string(name: 'VM_ID', value: params.VM_ID)
                ]
            )
        }
    }
}