-
Bug
-
Resolution: Fixed
-
 Major
Major
-
Jenkins ver. 1.435, windows XP, Warnings Plug-in 3.24
I am using the Warnings Plugin in a Jenkins job but I am experiencing some problems with the trend graphic.
My configuration scenario is:
Job Configuration:
Discard old builds option enabled with parameters: Max # of builds to keep=20 and Max # of builds to keep with artifacts=20
Post Build Action Scan for compiler warnings configured with Run Always option enabled and:

The result of the scan will fail or not the build (one or more warnings detected will lead to a failed build).
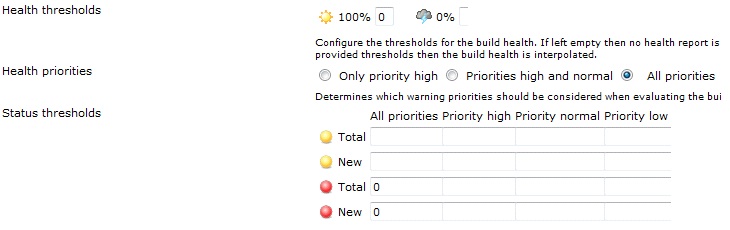
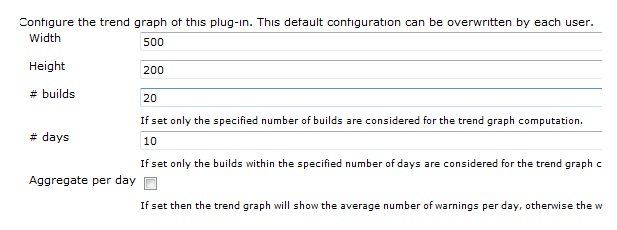
Graph Configuration:

In my procedure, I ran some builds of the configured job and as result the trend graph was:
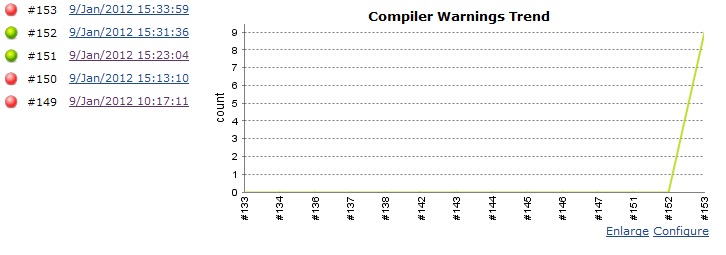
But I expected to see builds 149 and 150 warning results as well in this graphic.
Also I realized that if a build doesn't have warnings (successful build) as build 154 the graphic will be appear like:
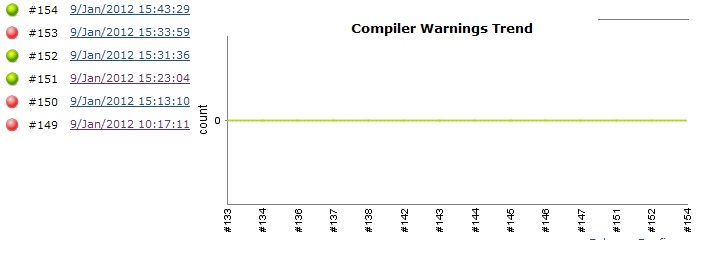
And I was expecting to have a graph with an history of all warnings in this case since build 149.
What kind of configuration should be modified/added to be possible to have a graph with an history of all warnings since build 149?