Uploaded image for project: 'Jenkins'
  1. Jenkins
  2. JENKINS-15969

Build Stats Plugin Returns so much data it hangs

      Using Global-Build-Stats 1.3 and Jenkins 1.470

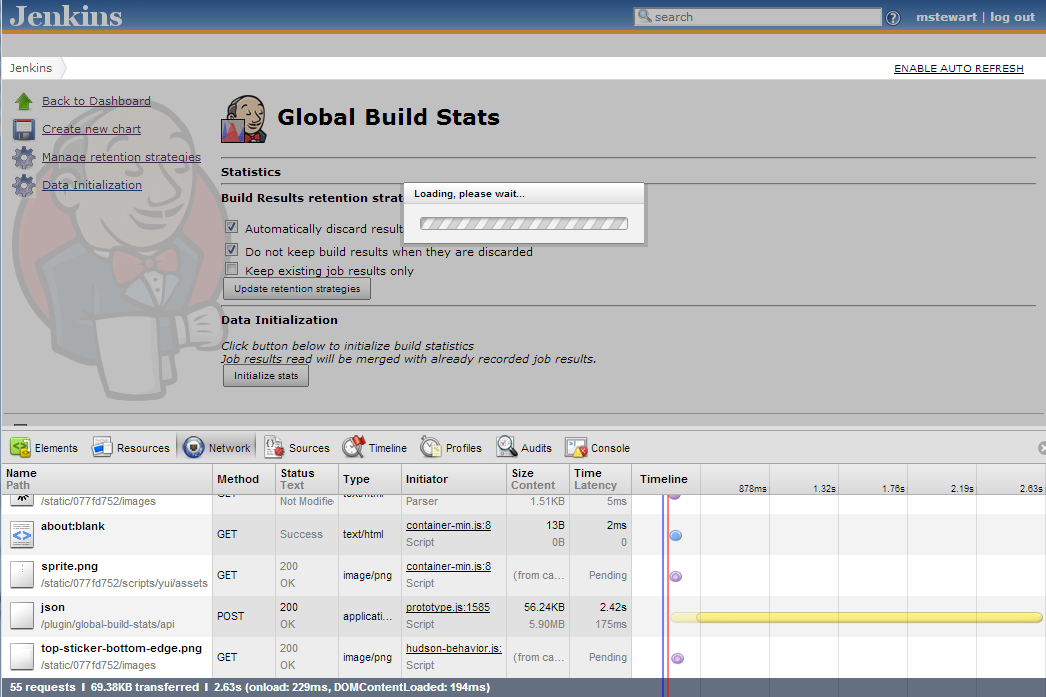
      I've configured about 6 graphs in our Jenkins environment. Now when clicking the global build stats link from the manage jenkins options, I get the attached screenshot. See the chrome network details in the image, what appears to be happening is the request to the following URL:

      http://jenkins:8080/plugin/global-build-stats/api/json?depth=2

      Never stops returning data, it reaches roughly 536kb of JSON streams before the browser just hangs/crashes/gives up.

      The charts I have plotted are 3 build stats charts for fairly busy Continuous Integration jobs over the past 14 days (daily aggregated stats over 14 days for success/fail etc) And the same time interval for Average Build Time.

      The individual api's for each chart work fine if I request the specific JSON data for the chart, I get accurate and clear data. Such as:

      http://jenkins:8080/plugin/global-build-stats/api/json?depth=2&buildStatConfigId=qTJa$m7WnHjwPakLc7PLhaer$ze*zypA

      Due to this issue however, I cannot configure any new charts, or remove charts.

      So I need two solutions. First, I need to get access to the configuration screen, which means I need a way to delete a chart configuration manually without relying on the configuration screen in Jenkins.

      Second, I need to know if this limitation is by design, if I've done something wrong, is this a genuine bug, can I fix this?

          [JENKINS-15969] Build Stats Plugin Returns so much data it hangs

          Frederic,

          Thanks for the response. I haven't yet tried just going straight to each chart I have other than hitting the JSON api for each to get data, which works fine. I'll test the individual charts today and see what I can find. There are a few charts that I don't know the key for, I had just made them recently, I do not know how to get the chart ID's for them outside the UI, is there any way to do that?

          I'm also unclear on what you mean by a "content file". Is this something in the Jenkins folders I can look at on disk? If so where is it? Thanks for your help so far I appreciate it! I'll respond back with the results of my individual chart testing.

          Maxfield Stewart added a comment - Frederic, Thanks for the response. I haven't yet tried just going straight to each chart I have other than hitting the JSON api for each to get data, which works fine. I'll test the individual charts today and see what I can find. There are a few charts that I don't know the key for, I had just made them recently, I do not know how to get the chart ID's for them outside the UI, is there any way to do that? I'm also unclear on what you mean by a "content file". Is this something in the Jenkins folders I can look at on disk? If so where is it? Thanks for your help so far I appreciate it! I'll respond back with the results of my individual chart testing.

          You can retrieve chart ids by sending a GET request to http://jenkins:8080/plugin/global-build-stats/api/json?depth=2
          Here, you will gather something like this :

          {
            "buildStatConfigs":[ {
              "averageBuildTimeShown":false,
              "buildFilters": {
                "abortedShown":true,
                "failuresShown":true,
                "jobFilter":"ALL",
                "launcherFilter":"ALL",
                "nodeFilter":"ALL",
                "notBuildShown":false,
                "successShown":true,
                "unstablesShown":true
              },
              "buildStatHeight":600,
              "buildStatTitle":"Distribution over time",
              "buildStatWidth":800,
              "buildStatusesShown":true,
              "dimensionsShown":["BUILD_COUNTER","BUILD_TOTAL_DURATION"],
              "historicLength":48,
              "historicScale":"HOURLY",
              "id":"HERE THE ID",
              "totalBuildTimeShown":true,
              "yAxisChartType":"COUNT"
            } ]
          }
          

          When I talked about the "content file", It is the size displayed in the chrome dev tool network tab : in your screenshot, we can see the JSON file is 5,90Mb which is very big compared to my JSON file.

          Frédéric Camblor added a comment - You can retrieve chart ids by sending a GET request to http://jenkins:8080/plugin/global-build-stats/api/json?depth=2 Here, you will gather something like this : { "buildStatConfigs" :[ { "averageBuildTimeShown" : false , "buildFilters" : { "abortedShown" : true , "failuresShown" : true , "jobFilter" : "ALL" , "launcherFilter" : "ALL" , "nodeFilter" : "ALL" , "notBuildShown" : false , "successShown" : true , "unstablesShown" : true }, "buildStatHeight" :600, "buildStatTitle" : "Distribution over time" , "buildStatWidth" :800, "buildStatusesShown" : true , "dimensionsShown" :[ "BUILD_COUNTER" , "BUILD_TOTAL_DURATION" ], "historicLength" :48, "historicScale" : "HOURLY" , "id" : "HERE THE ID" , "totalBuildTimeShown" : true , "yAxisChartType" : "COUNT" } ] } When I talked about the "content file", It is the size displayed in the chrome dev tool network tab : in your screenshot, we can see the JSON file is 5,90Mb which is very big compared to my JSON file.

          Ahh, thank you for the response, yes the content file was my major concern something was clearly wrong. Unfortunately we had to restart Jenkins today for other reasons and when the restart completed all my build stat configs were gone. Once I recreated them, everything is work exactly as I'd expect it to.

          For record please note that the URL gave me to get my chart names is the same URL that was generating the content file and just spewing huge amounts of data right down to the depth=2 so I wouldn't have been able to discover the chart configuration names that way.

          As it is, because the restart deleted all my configs and the problem as gone away, you can probably close this ticket. Thanks for the help however!

          Maxfield Stewart added a comment - Ahh, thank you for the response, yes the content file was my major concern something was clearly wrong. Unfortunately we had to restart Jenkins today for other reasons and when the restart completed all my build stat configs were gone. Once I recreated them, everything is work exactly as I'd expect it to. For record please note that the URL gave me to get my chart names is the same URL that was generating the content file and just spewing huge amounts of data right down to the depth=2 so I wouldn't have been able to discover the chart configuration names that way. As it is, because the restart deleted all my configs and the problem as gone away, you can probably close this ticket. Thanks for the help however!

          Ok
          Don't hesitate to reopen it if you re-face the same problem.
          I'm worried about it.

          Frédéric Camblor added a comment - Ok Don't hesitate to reopen it if you re-face the same problem. I'm worried about it.

          John Waitforit added a comment - - edited

          I am experiencing this problem.

          Jenkins version: 1.473
          Global Stats Plugin version: 1.3
          Chrome version, if relevant: 28.0.1500.71

          The course of events:

          • installed the plugin, restarted jenkins
          • created 4 graphs, then edited their dimensions, range, etc.
          • reordered the graphs on the page - worked for most of them, but when I tried to move the last one up I got some error (in an alert window)
          • reloaded page - then reloading took so long it crashed the page
          • using task manager in chrome I observed that the memory usage went over 1GB for just that page
          • the developer tools showed a very large json file downloaded for /global-build-stats/api/json?depth=2
          • when that finished, it spawned a huge number of requests to obtain the graph images - those actually killed the page
          • somewhere in between I investigated the files on the server
          • I tried to remove the file global-build-stats.xml, no luck - it gets regenerated
          • I tried to edit it and leave only a few <bsc /> nodes (note that there are literally thousands of <bsc /> nodes having the following template <bsc reference="../bsc[ {number}]" />, where {number}

            seem to be random numbers (up to or over 125), with 7 and 2 being probably the most frequent (not sure if relevant)

          • editing that file didn't seem to fix it (file got regenerated and overwritten)
          • I also tried to clear the data in global-build-stats/jobresults, but nothing changed (the data for the last month seems to be regenerated)

          Note that the json returned by global/build-stats/api/json?depth=2 returns that large json which actually contains mostly the same two graphs repeated over and over again (hundreds, maybe thousands of times). Also, I requested, as suggested, that deleteConfiguration resource - which returned "ok" (whatever, some short json with "ok" in it), but the chart generation resource still returns the chart image for that same id.

          John Waitforit added a comment - - edited I am experiencing this problem. Jenkins version: 1.473 Global Stats Plugin version: 1.3 Chrome version, if relevant: 28.0.1500.71 The course of events: installed the plugin, restarted jenkins created 4 graphs, then edited their dimensions, range, etc. reordered the graphs on the page - worked for most of them, but when I tried to move the last one up I got some error (in an alert window) reloaded page - then reloading took so long it crashed the page using task manager in chrome I observed that the memory usage went over 1GB for just that page the developer tools showed a very large json file downloaded for /global-build-stats/api/json?depth=2 when that finished, it spawned a huge number of requests to obtain the graph images - those actually killed the page somewhere in between I investigated the files on the server I tried to remove the file global-build-stats.xml, no luck - it gets regenerated I tried to edit it and leave only a few <bsc /> nodes (note that there are literally thousands of <bsc /> nodes having the following template <bsc reference="../bsc[ {number}]" />, where {number} seem to be random numbers (up to or over 125), with 7 and 2 being probably the most frequent (not sure if relevant) editing that file didn't seem to fix it (file got regenerated and overwritten) I also tried to clear the data in global-build-stats/jobresults, but nothing changed (the data for the last month seems to be regenerated) Note that the json returned by global/build-stats/api/json?depth=2 returns that large json which actually contains mostly the same two graphs repeated over and over again (hundreds, maybe thousands of times). Also, I requested, as suggested, that deleteConfiguration resource - which returned "ok" (whatever, some short json with "ok" in it), but the chart generation resource still returns the chart image for that same id.

          Alex Gray added a comment -

          This is an old ticket, but just for the record, I'm seeing this too (global/build-stats/api/json?depth=2 returns insane amounts of data) :
          Jenkins ver. 1.596.2
          Global Stats Plugin version: 1.3
          I'm hesitant to delete my charts, but if that is the only way to make this plugin work, then I'll do it.

          Alex Gray added a comment - This is an old ticket, but just for the record, I'm seeing this too (global/build-stats/api/json?depth=2 returns insane amounts of data) : Jenkins ver. 1.596.2 Global Stats Plugin version: 1.3 I'm hesitant to delete my charts, but if that is the only way to make this plugin work, then I'll do it.

          I've encountered a similar issue, Jenkins ver. 1.588 and plugin ver. 1.3. It takes a long time to load the three charts I've created. There is a lot of duplication in global-build-stats.xml with thousands of lines like these...

              <bsc reference="../bsc[2]"/>
              <bsc reference="../bsc[6]"/>
              <bsc reference="../bsc[14]"/>
          

          And when I open the dev console in Firefox and view the network tab there are thousands of requests like this

          https://jenkins:8080/plugin/global-build-stats/showChart?buildStatId=RopHvBTaaKImO4exe1!cvEufZ*UUKLqM&time=1448053243783
          

          I can't seem to be able to purge the bad config. Something I'm wondering that could be related is that when I was first configuring the graphs I had auto-refresh enabled and it was making it difficult to save configuration. Is it possible that trying to save configuration with auto refresh enabled that the configuration was saved numerous times?

          Jonathan McCall added a comment - I've encountered a similar issue, Jenkins ver. 1.588 and plugin ver. 1.3. It takes a long time to load the three charts I've created. There is a lot of duplication in global-build-stats.xml with thousands of lines like these... <bsc reference= "../bsc[2]" /> <bsc reference= "../bsc[6]" /> <bsc reference= "../bsc[14]" /> And when I open the dev console in Firefox and view the network tab there are thousands of requests like this https: //jenkins:8080/plugin/global-build-stats/showChart?buildStatId=RopHvBTaaKImO4exe1!cvEufZ*UUKLqM&time=1448053243783 I can't seem to be able to purge the bad config. Something I'm wondering that could be related is that when I was first configuring the graphs I had auto-refresh enabled and it was making it difficult to save configuration. Is it possible that trying to save configuration with auto refresh enabled that the configuration was saved numerous times?

          Having the same Issue when I create a graph it mulitplies the configuration entries each time, I edit the graph.
          This caused about 2500 entries in a view minutes, which I can see here: /jenkins/plugin/global-build-stats/api/json?depth=2 .

          I am using Jenkins 1.642.3 and pluginversion 1.3.

          Ludwig Richter added a comment - Having the same Issue when I create a graph it mulitplies the configuration entries each time, I edit the graph. This caused about 2500 entries in a view minutes, which I can see here: /jenkins/plugin/global-build-stats/api/json?depth=2 . I am using Jenkins 1.642.3 and pluginversion 1.3.

          saraswathi sankar added a comment - - edited

          Jenkins Version: 1.509.2
          Global Build Stats Plugin Version: 1.3

          I hit this issue and followed the steps to delete the charts, but in vain. Any session that i open in Chrome / Firefox / IE in any machine simply hangs and does not load the charts.

          Any help would be much appreciated.

          saraswathi sankar added a comment - - edited Jenkins Version: 1.509.2 Global Build Stats Plugin Version: 1.3 I hit this issue and followed the steps to delete the charts, but in vain. Any session that i open in Chrome / Firefox / IE in any machine simply hangs and does not load the charts. Any help would be much appreciated.

          Was able to resolve the issue in a very crude way - by deleting global-build-stats.xml file and restarting Jenkins master.
          Enabling auto refresh seemed to have been the culprit, i guess...

          saraswathi sankar added a comment - Was able to resolve the issue in a very crude way - by deleting global-build-stats.xml file and restarting Jenkins master. Enabling auto refresh seemed to have been the culprit, i guess...

            fcamblor Frédéric Camblor
            maxfields2000 Maxfield Stewart
            Votes:
            4 Vote for this issue
            Watchers:
            9 Start watching this issue

              Created:
              Updated: