-
Type:
Bug
-
Resolution: Unresolved
-
Priority:
Critical
-
Component/s: global-build-stats-plugin
-
None
Using Global-Build-Stats 1.3 and Jenkins 1.470
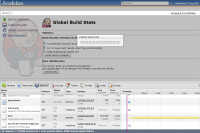
I've configured about 6 graphs in our Jenkins environment. Now when clicking the global build stats link from the manage jenkins options, I get the attached screenshot. See the chrome network details in the image, what appears to be happening is the request to the following URL:
http://jenkins:8080/plugin/global-build-stats/api/json?depth=2
Never stops returning data, it reaches roughly 536kb of JSON streams before the browser just hangs/crashes/gives up.
The charts I have plotted are 3 build stats charts for fairly busy Continuous Integration jobs over the past 14 days (daily aggregated stats over 14 days for success/fail etc) And the same time interval for Average Build Time.
The individual api's for each chart work fine if I request the specific JSON data for the chart, I get accurate and clear data. Such as:
Due to this issue however, I cannot configure any new charts, or remove charts.
So I need two solutions. First, I need to get access to the configuration screen, which means I need a way to delete a chart configuration manually without relying on the configuration screen in Jenkins.
Second, I need to know if this limitation is by design, if I've done something wrong, is this a genuine bug, can I fix this?
