-
Type:
Bug
-
Resolution: Fixed
-
Priority:
 Major
Major
-
Component/s: performance-plugin
-
None
-
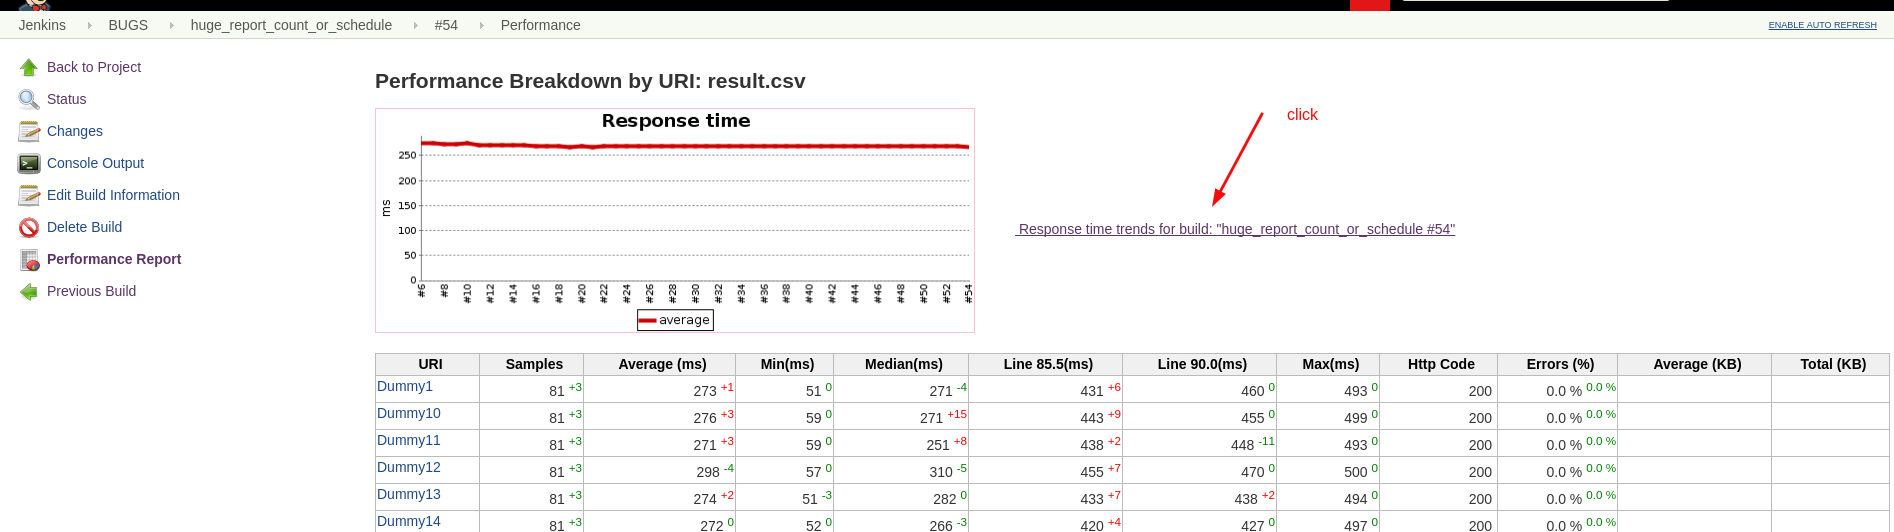
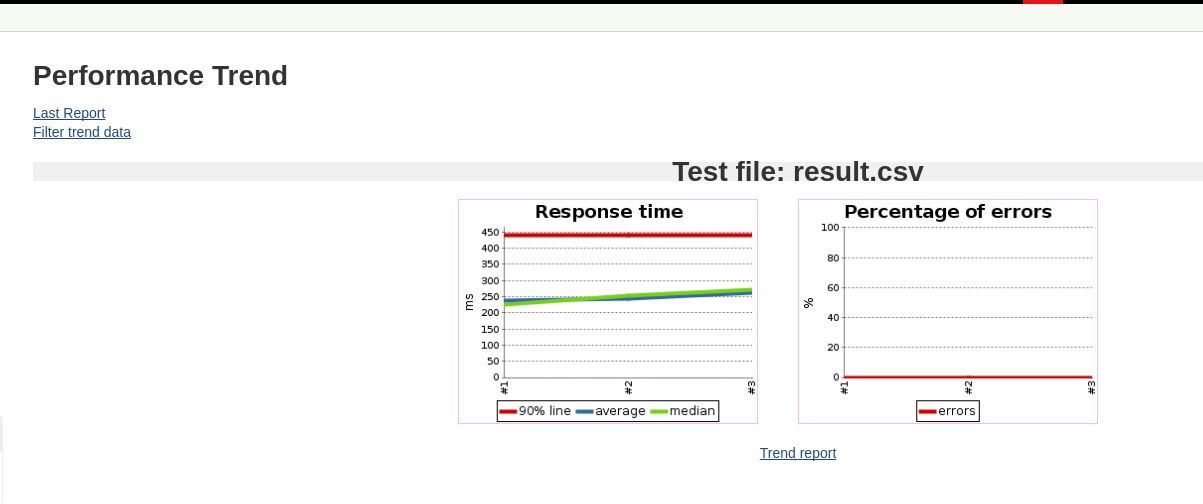
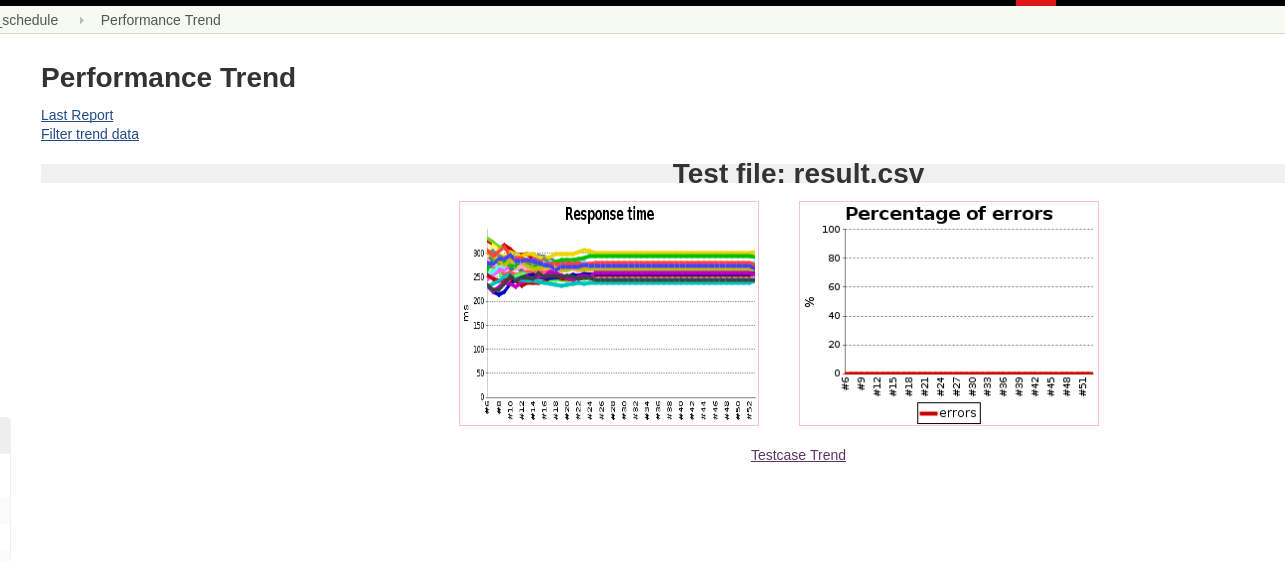
Environment:Performance Plugin version 3.5 is installed
In per test mode window, only "Response time" graph shows the trend for each test. "Throughput" and "Error" graphs should show trend for each test as well rather than the summary trend, since the mode is called "per test". All of the summary trends have been showed in the summary window already.


- is related to
-
JENKINS-18576 Add throughput column to performance plugin charts
-
- Reopened
-

