-
Type:
Improvement
-
Resolution: Fixed
-
Priority:
 Minor
Minor
-
Component/s: disk-usage-plugin
-
None
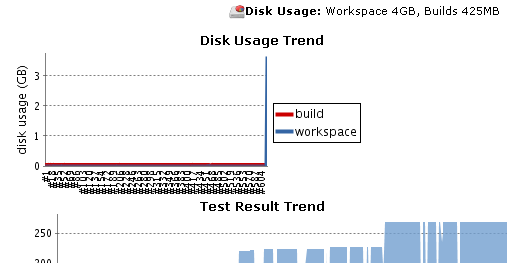
Most of my graphs look like the attached image.
You could have another scale on the right hand side for the x axis, so that workspace could be shown on a 0-4GB scale, while builds could be plotted against a 0-500Mb scale.
e.g. see this graph http://media.economist.com/sites/default/files/imagecache/original-size/20110205_WOC101.gif