Details
-
Bug
-
Status: Open (View Workflow)
-
Major
-
Resolution: Unresolved
-
None
Description
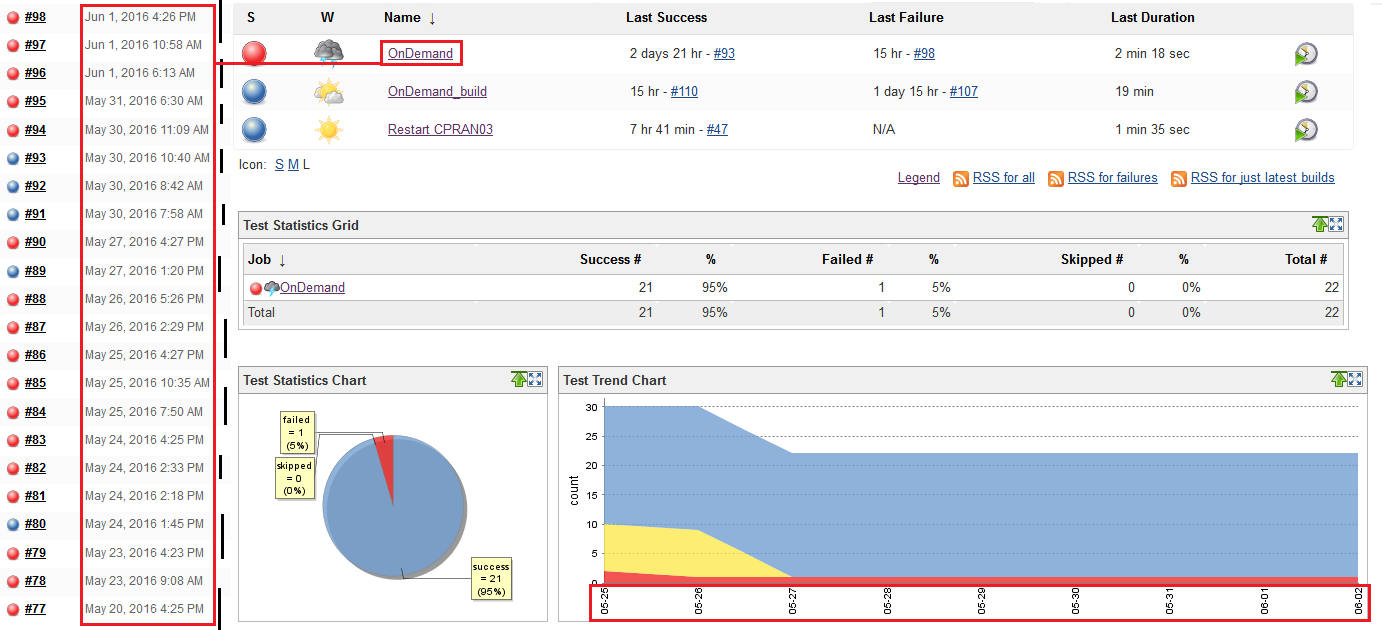
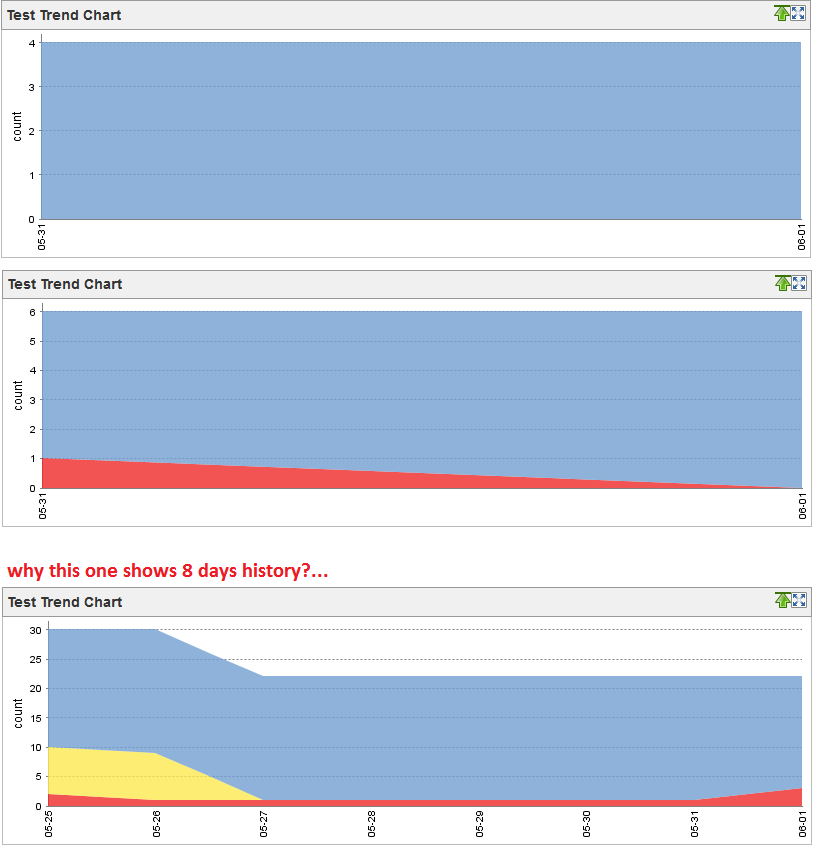
I have 3 different views, each view contains between 1-3 test jobs. The Test Trend Chart shows just one day for two views (with 2 or 3 test jobs), while the Test Trend Chart in one particular view shows 8 days? However, neither number of days reflects "Number of (latest) days to display", which I have 14 days for each view?
So based of which number/Jenkins setting does Test Trend Chart display its history?
What are the build dates of the jobs shown on those test trend graphs? I went looking into this area of the code, and it will not show old dates if there are no builds...
i.e.: job1: had builds on Mon, Wed, Fri
job2: had builds on Tues, Wed, Thurs
jab3: had builds on Tues, Fri
If it is now Friday, and the date range is 3 days, then jobs 1&2 would should builds from Wednesday through Friday, but Job3 would only show Friday (even though there is an older build in the history).
If that's what's going on, then it seems to be working as designed