-
Type:
Bug
-
Resolution: Fixed
-
Priority:
 Critical
-
Component/s: workflow-cps-plugin
-
workflow-cps 2.66
I have a lot of Pipeline Jobs that are waiting for user input before deploying to production. It is quite normal, that pipelines are in this state for several days.
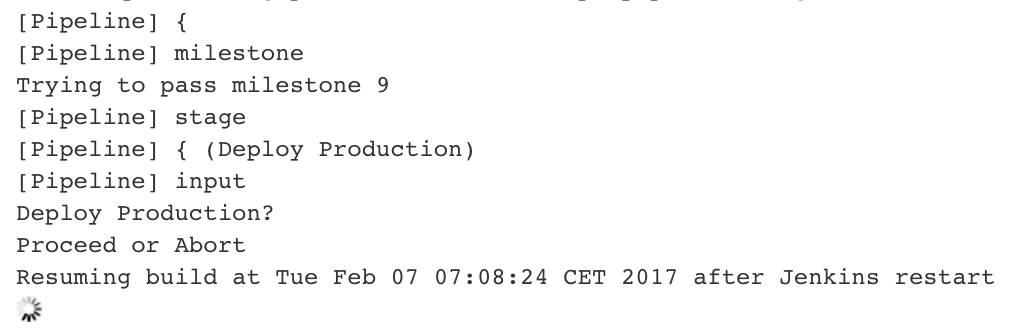
After a Jenkins restart (e.g. because of a Jenkins Update) the Pipelines are still in running state, but the user input controls are missing.
log
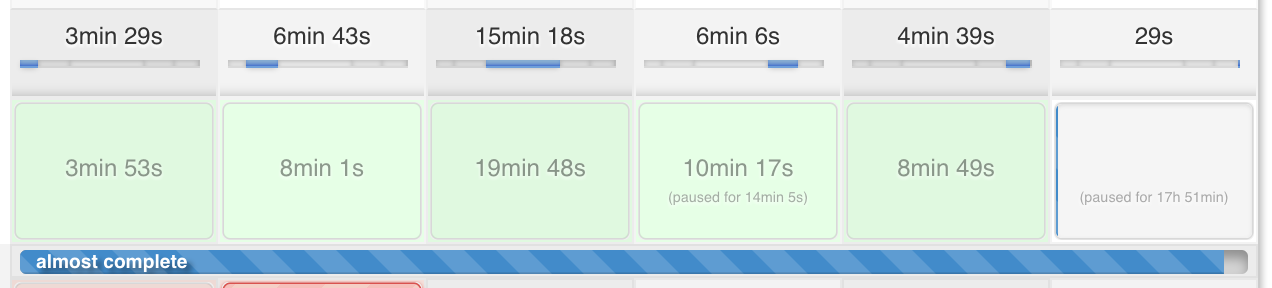
pipeline view
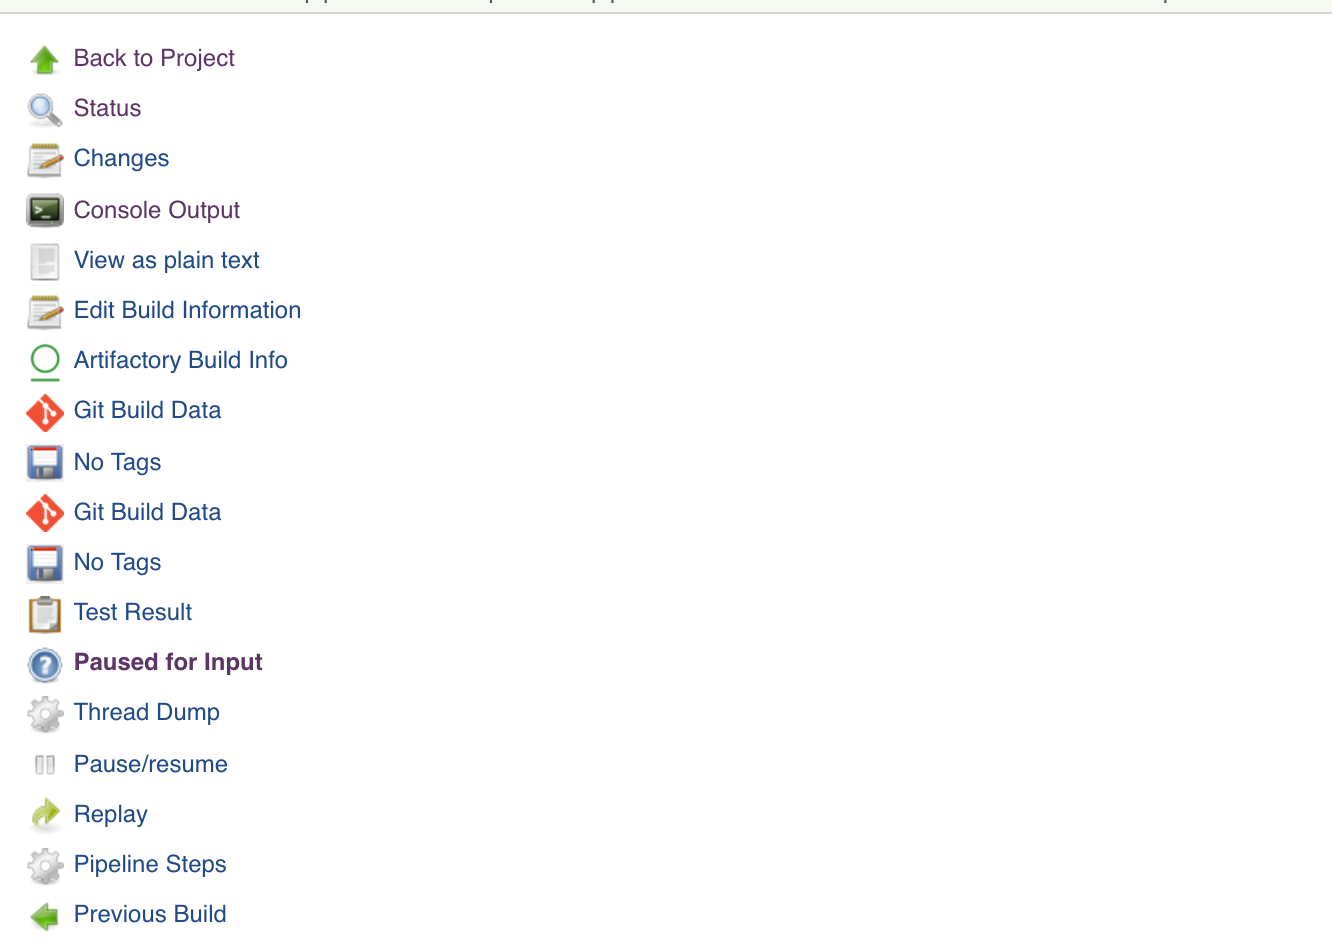
paused for input
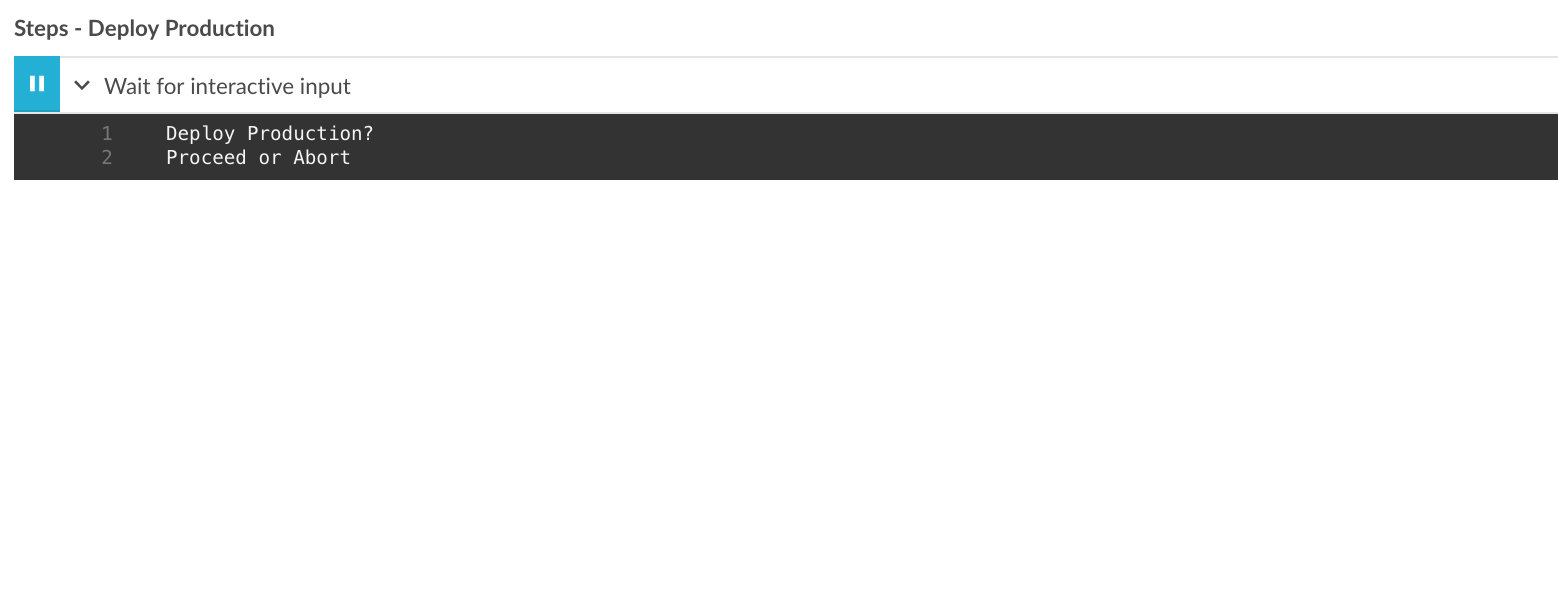
Paused for input is available, but the controls are missing.
blue ocean


- duplicates
-
-

- Resolved
-
- relates to
-
-

- Resolved
-
-
-
- Resolved
-
-
-
- Resolved
-
-
-
- Closed
-
- links to

